

Nucleic-Acid Profiling by Oligonucleotide Hybridization Fingerprinting Current human over-population and the logically consequent expansion of novel viral diseases combined with the widening spread of antibiotic resistance among the “traditional” human pathogens calls more and more for inexpensive, rapid and universally-applicable detection methods – capable of detecting wide-variety of pathogens in a single test run. The epidemiological consequences resulting from the increased world-wide mobility of the human population is also demanding for disease detection novelty – which is well demonstrated by the rapid progression of viral infectious diseases eclipsing with the social and economic amok caused by the COVIR-19 disease.
The current state of medical diagnostics is incapable to serve this
purpose because it relays upon traditional technologies employing (1)
antibody tests (that are both too specific to single-type microorganisms
yet, either extremely specific or too low-specific to the detection of
sub-varieties of particular species; they simply lack the high detection
precision of DNA-based detection) or (2) Polymerase Chain Reaction (PCR)
based tests that are highly precise and can be moderately flexible to
cross-species recognition, yet they require both time- and equipment
investment to be able to become comfortably field-employed.
Although the above assessments seams to hint at a dead-end road,
there is amazing technology that has lately become forgotten regardless the
fact that it was developed more than 30 years ago. And the reason for that
is, because its capabilities failed to be well-argued and widely proven, and
because very-few scientists were experts in the field with the rest of the
community being under-proficient to the scope of its applicability.
This technology was called “Sequencing by Hybridisation” (SBH) with
its off-spring
-
DNA-chip technology. Out of many serious attempts during the 1990s to
commercially develop and justify its economic sense, practically only very
few companies survived to still exist in the field – with questionable
profitability and murky future. Although development started over 25 years
ago, efficient practical implementation of the microarray technology is
lagging behind its advances and immense medical and commercial potential.
Current expression arrays are still expensive and inflexible. They are
custom-designed for each organism and they do not offer the possibility of
incorporating updated genomic information without production of a new chip.
Note, however, that a patent has been issued allowing to use all data
generated by any-kind of DNA arrays and re-analyzed in different prospect
and means to allow for dramatic increase in scope and usefulness of the
information incorporated in those chip-based data results (U.S. Patent
7,031,745); that is at least 10-fol increase in informational data.
Nevertheless in 1993 there was one research “off-spring” that was apprised
by and granted the intellectual rights from
US DOE and Argonne National
Laboratory (ANL) [DOE Case No. S-82,524, ANL-IN-94-109 “DNA Library Characterization By
Oligonucleotide-Based Clone Fingerprinting (Coding) that was able to prove for the first time in
the world the mind-blowing ability of the SBH and Chip-based technology
approach developed by Dr. Chris Dyanov for practically unlimited detection
capability coupled with unlimited inter-species detection ability – so much
so, that, if precisely designed, it allows for the detection of the
existence of unknown microbial pathogens regardless of the species host they
may reside in. Today, all this sounds so much too-good-to-be-truth – as much
as it did back in the 90s.
The reason the technology
remains undeveloped for over 30 years is that it sounds pretty-much as a
science-fiction and because its unusual complicity makes it difficult to be
communicated and to become correctly understood. Yet, we have all scientific data available to provide for the
understanding of its true capabilities being practically tested and verified
long time ago. We, and some others had called this technology Gene
Fingerprinting by Hybridisation (GFH).
The Gene Fingerprinting by Hybridisation (GFH) is an off-spring of
the SBH approach first developed in late 1980s by the mathematician William
Barns [Bains,
W. and Smith, G.C.
A Novel Method for Nucleic Acid Sequence Determination.
J. Theor. Biol.
(1988) 135, 303-307]
and tested experimentally in 4-6 laboratories in the World at that time. The
version of SBH we have pioneered and employed is quite simple as an idea,
but requires significant both research-and-development and computation
resources, both of which are not limiting factors today.
Simply, the idea is this:
If one design, chemically synthesize and manufacture on a chip a relatively
modest number of proper DNA molecules (say, several thousand up to a
100,000) – that chip will be capable to provide for creating a fingerprint
of extremely large amount of genes regardless of
which- and of how many
different species the gene originated from – that being achieved by both bio-chemical and/or
electrochemical detection, and computational analysis. Thereby, this
technology can serve as unlimited and highly-precise detection approach
serving both medical- and National bio-security detection applications.
We were able to prove practically the capability of this technology as
yearly as during the period 1993-2003.
Below we will describe and present some results obtained by the
application of this technology without disclosing too much precise
proprietary information and with some simplifying in order to make it easier
to understand.
But first, a short introduction will be given in order to elaborate
an idea as to the scope and the challenges faced at the start of this
project.
BACKGROUND OF THE TECHNOLOGY
Every feature in every organism in Earth from the simplest ones (viruses) to
the genetically most-complicated ones (plants) is encoded, expressed and
passed in generation by chemical bio-macromolecules called RNA and DNA
(ribo- and deoxyribo-nucleic acids). Within their chemical structure, four
molecular features,
called “bases”, serve as the code letters (named A,U,C,G in RNA and
A=adenine),T= thymidine, C=cytosine ,G=guanidine in DNA) that are capable of
recognizing each-other in
pairs of
complementarity A-T (respectively, A-U for RNA) and C-G, as well as
being recognized biochemically by the cellular machinery to proceed with
implementing the base-encoded information into life biochemical events and
structures.
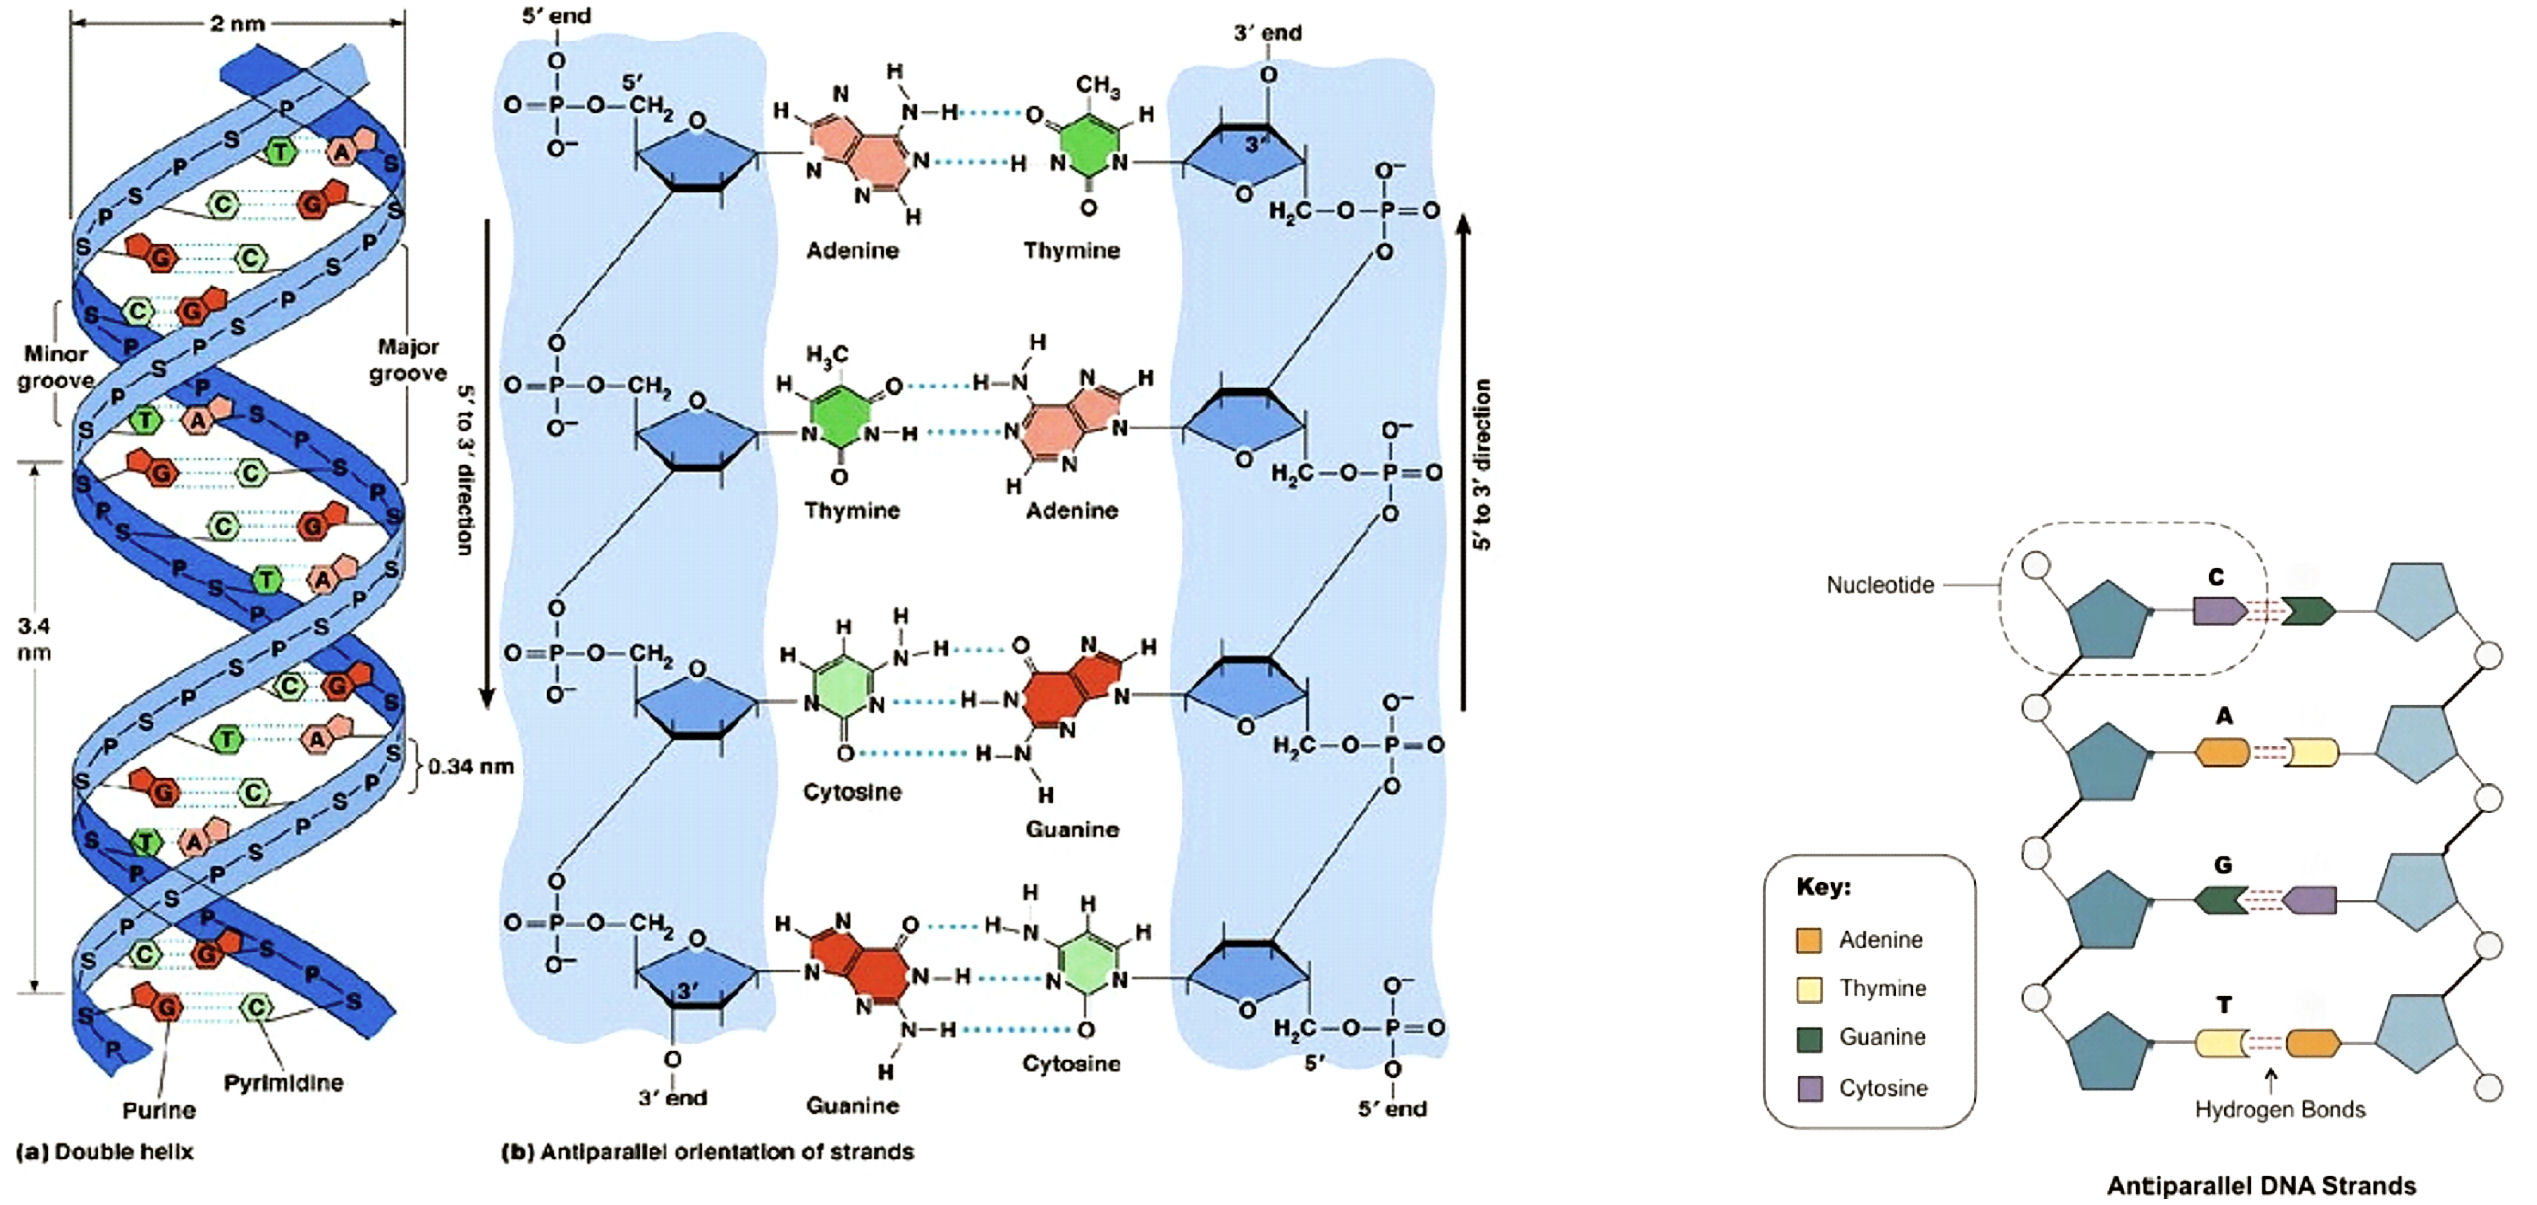
Figure 1:
Structure of a DNA molecule. (from:
Principles of Cell Biology (BIOL2060). Available online:
http://BIOL2060/BIOL2060-18/18_04.jpg
or
the link here.
Smallest-size genome identified is from a Viroid family (viroids are the
smallest known pathogenic agents) and one of the smallest belongs to the
Grapevine yellow speckle viroid with 220 nucleotides only,
and the Rice yellow mottle virus satellite with 220 bp (base-pairs);
then Avocado sunblotch viroid (ASBV) – a linear genomic RNA with 247
BP size (https://www.ebi.ac.uk/genomes/viroid.html).
Let’s also mention some of the smallest organisms we know – bacteria. The
smallest bacterium yet sequenced comes in at only 112,000 letters, and was
discovered living inside of a tiny insect. A common and well-studied
bacterium, E.
coli, has a genome of around 4,600,000 nucleotides - only about
1/1,000th the length of the human genome.
With only 4 different letters, this information this seems simple enough –
until you realize that the human genome is about 3 billion letters long!
That’s a lot of possible ways to arrange those 4 nucleotides. With the
exception of identical twins, every human being has a slightly different
order of letters in their genome. And just one single cell
-
a skin cell, let’s say, – contains one copy of that entire genome.
3,000,000,000 is a lot of letters. If one considers that a typical 250-page
book has about 500,000 letters, that means - it would take 6,000 books to
hold one person’s genome. But the human genome is nowhere close to the
size of the biggest genome out there.
The record is currently held by a rare Japanese flower named Paris
japonica, coming in at 150 billion nucleotides
– 50 times the size of the human
genome! Next
biggest animal genome belonged to the marbled lungfish with 130 billion base pairs
Figure 2.
Paris japonica,
the rare Japanese flower that holds the current record for largest
eukaryotic genome at 149 billion nucleotides. Eucaryotes are species in the
cells of which the nucleus including the DNA is separated from the rest of
the cell content by a membrane; these are more evolutionary-advanced species
than the most microbes (i.e. the prokaryotes).
How is it possible that a humble little flower can have so much DNA in one
of its cells? Simply, because there is more to a genome than just the total
number of nucleotide letters. Not all of those letters actually give
instructions to make something. In fact, only a fraction of a genome
actually has the information for building the chemicals the cell needs. One
“coding” region, known as a gene, holds the instructions for how to make one
protein. Even though the human genome is 3 billion letters long, it only
holds about 20,000 genes that are known to be structural genes, i.e.
to code for the synthesis of a bio-chemical molecule (a structure).
So, in the case of the Japanese flower with the massive genome, much of that
DNA contains actually duplicate copies of the plant’s genes. In summary,
more DNA does not necessarily mean more information
-
in this case, it is sort of like having 100 copies of the same novel rather
than having 100 different novels. These copies are not necessarily
meaningless, however
-
gene duplication can lead to novelties and effects that scientists are still
working to understand.
Table
1. Genome
sizes of just a few of Earth’s organisms.
In the animal kingdom, the relationship between genome size and evolutiona-ry
status is not clear. One of the largest genomes belongs to a very small
creature, Amoeba dubia. This protozoan genome has 670 billion
units of DNA, or base pairs. The genome of a cousin, Amoeba proteus,
has a mere 290 billion base pairs, making it 100 times larger than the human
genome.
Figure 3.
Microscope photo of
Amoeba dubia
(top) and
Amoeba proteus
(bottom) – the champions in genome size.
Whether
it is a tiny bacterium inside an insect or a towering spruce tree, every
living thing we know of
-
shares the same 4-letter instruction code. Humans fall in the middle of the
pack in terms of genome size, but there is more to a genome than just the
overall length. The part that actually gives unique instructions does not
always match up with the total size.
While it is indeed a big deal, sequencing an entire genome
of a living being is still
just only a first step toward decoding the principles of genetic information
storage and interpretation. Figuring out what all those letters really mean
in the way they are arranged is an even bigger task, and many discoveries
have yet to be made inside the genomes of Earth’s organisms.
A Simplified Explanation of the Gene Fingerprinting
Technology
Immense practical needs in the medicine and genetics (in diagnostics)
will be served, if a practically simple and rapid technology is developed to
allow for sequencing, or for code-based identification of genes
obtained from live organisms.
Here, in simple terms we will explain the goal to be achieved and
complications that needs to be solved.
1.
Let’s imagine that one gene (encoded with only 4 letters) is a page-long
sentence (2,000 letters long each, for a median size gene) and it belongs to
a book with multiple “chapters” (chromosomes; 46 in total in a Human genome
in 23 almost-identical pairs), and the book is 1.5 million (1,500,000)
pages.
2.
For the purpose of any practical gene analysis, all 1.5 million pages has to
be shredded horizontally to separate rows of text with no spaces and
punctuation between the 4 letters of code. That would result to a random
rows’ mix of approximately 6 million 6,000,000 text-strips (if each strip
contains 500 letters, or ¼ of a gene). Unfortunately, in the real practice,
at least 1,000 cells are needed to obtain these fragments of DNA/RNA for a
study, so in our basket to analyze, we now have not 6 million, but 6 billion
(6,000,000,000) pieces of genetic fragments or “paper-strips”!
Figure 4.
Simplified
scheme of genome analysis principles – DNA probe preparation and
oligonucleotide “fishing”.
3.
The minimal goal is to achieve capability to detect and identify the
presence of 1 page out of several millions based upon reading the
information from single-row strips that belong from that “page” we here
addressed as a gene. The technology for the minimal goal already exists, but
it takes from few hours to few days and serious machinery to achieve
a particular gene identification.
The maximum goal
would be to identify each one of the several billion fragments that
belong to the book (one genome) and, eventually, to restore all page numbers
and sort each strip with letters into specific pales of
strips – corresponding to the
numbered page (gene) they belong to. Although there is some progress in this
direction, no credible technology is capable of achieving this in rapid
fashion, nor to a practically meaningful commercial extent.
4.
How the puzzle can be solved:
Figure 5.
Simplified scheme of genome analysis - Constructing gene contigs
Oligonucleotide-based Fingerprinting Insights
In
order to find the correct relative placement between all the DNA-fragments
obtained from a (organism), some information on DNA clones (i.e. clones of
the genes studied) overlaps must become available during the analysis. In
the technique of oligos
fingerprinting, short labeled DNA-sequences, or oligo
probes, do attach via
the phenomenon of complementarity pairing (or, as professionally called –
they hybridize),
to corresponding positions along the target DNA of the clone (i.e.
gene-copy) matching their own DNA sequence (precise “fishing”
-
that is). For this purpose, the oligonucleotide probes are usually
non-unique, i.e., they occur at many points along the genome (within
different genes), and typically they will hybridize with 1-50% of all the
gene clones in a studied sample. The figure below illustrates the
hybridization scenarios (in red color) as being computationally aligned
along a particular target DNA sequence:
Fig.6:
Oligonucleotide-based Genome Investigation Strategies. In red are shown the
specific places within the genome DNA fragments where labelled probe-oligos
had attached during the hybridization molecular binding.
Oligonucleotide-based fingerprinting strategy is using oligos to
create a “fingerprint” for the identification alone of majority of gene
fragments existing in a biological probe. Mapping is an approach not
only to identify the genes in a probe, but to allow for their localization
(mapping) onto a known (or unknown) genome map by exploiting the overlapping
sequences of the used oligos being computationally reconstructed
(overlapped); it allows for the creation of genome maps with relatively
precise positioning of the genes within a genome (i.e. where are positioned
the pages within a genome book). Sequencing by oligonucleotide
hybridization (SBH) allows not only for fingerprinting and
mapping the genes in a sample DNA mix, but for reading and computational
reconstruction of the entire precise-identification of each letter and its
position within a gene, and within the entire genome (i.e. precise
reading\decoding of all gene information). For the purpose of SBH, all used
oligo sequences must allow for their continuous and uninterrupted overlap
exploited in computational reconstruction of the entire gene (genome)
sequence.
Physical Mapping of DNA and Terminology
Physical
mapping is the process of determining the relative position of genetic
markers (sequences) along the DNA. The resulting genetic maps are used
further as a basis for DNA sequencing, and for the isolation and detailed
characterization of individual genes or other DNA regions of interest. The
construction of a high-resolution physical map of the entire human genome,
and that of other organisms, is one of the top priorities of the Genome
Projects. The mapping process involves the production of genetic
clones, i.e., cloned
pieces of DNA or RNA, each representing a chromosomal (genome) segment. The
mapping itself is the reconstruction of the order of and physical distance
between the DNA-clones – based upon the overlapping on the oligo sequences
used for their identification by the means of the multipoint hybridization
results. Below is an example of a physical map reconstructed by
computationally aligning the position of each and all DNA-clone mapped onto
the known genome or onto a newly-constructed genome map.
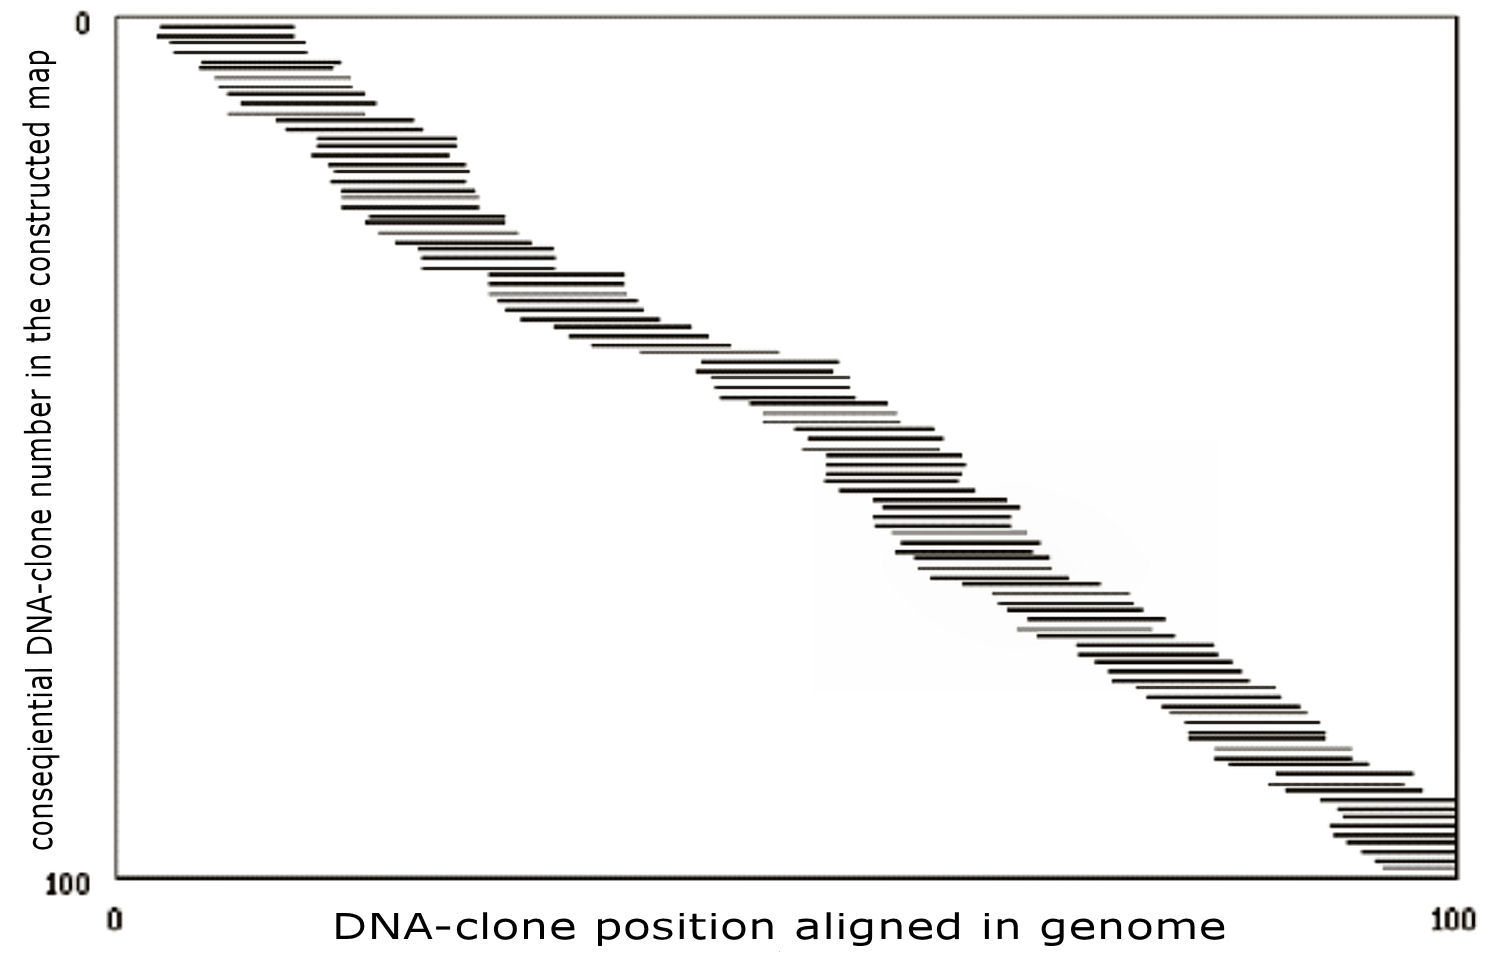
Figure 7:
Physical genome mapping strategy.
The
short horizontal lines are the DNA clones with their
x-coordinates
corresponding to their position on the (original) target genome. The
y-coordinates correspond
to the DNA clone overlapping-order in the computationally constructed map.
Note that each point on the target genome is covered by many clones – as is
the real-life clone representation within gene libraries constructed by
scientists. The total length of the DNA clones divided by the length of the
genome is called the clone
coverage (10 in this example on the figure). The location of the
DNA clones along the target genome is not directly known to the
experimenters – experimental mapping data, such as the
oligonucleotide-hybridization data, is generally used in attempt to
reconstruct the entire genome map. The solution to the mapping task is
generating a sequence list for every DNA-clone that gives its estimated
position on the genome map. A list of DNA-clones covering a continuous
section of the genome together with their physical distances and sequences
is called a contig.
With a sufficient (synthesized and hybridized) oligonucleotide coverage, the
whole genome map is usually one contig. Such a plot of DNA clone order in
the constructed map vs. the real clone position provides a visual
map-quality measure. Small errors, which do not change the clone order,
cannot be seen from the plot. A completely random solution will correspond
on the map to randomly placed (-aligned) clones, whereas a non-random
solution containing several large errors will look like randomly placed
broken contigs with approximately correct intra-contig order (see the Figure
7).
OUR Oligonucleotide
Hybridization Methodology
The methodological approach for oligo fingerprinting hybridization
consists of the following steps:
1)
Prepare oligonucleotide chip by chemically synthesizing short oligo probes
and chemically attach them to a solid surface to allow to manipulate all of
them simultaneously. The surface can be optically transparent or not, but to
allow for optical acquisition of the hybridization result; or to allow for
electrochemical acquisition – as a computer microchip. It could be made from
plastic, glass, silicone or metal-coated surface.
2)
Obtain and process DNA or RNA from a biological source in order to prepare
solubilized pool of mixed DNA-fragments for their analysis by hybridizing
them on the chip where each of them will bind to any and all oligos deposed
on the chip if a corresponding sequence to an oligo of the chip is
presented in perfect-match on a probed DNA-fragment (clone) in the
solution. Of course, the biochemical conditions for the perfect-match
binding (“fishing”) are mastered proprietarily a priori.
3)
Design and explore conditions and measurements for precise quantitative
measurement of each and all binding (hybridization) events on the chip in
order to acquire complete data for all hybridization events to be used later
in computational analyses.
4)
Computationally manipulate all acquired hybridization data so to eliminate
interferences and to achieve comparable and interpretable results for
further computational analyses among multiple hybridization events, multiple
different chips and multiple biological samples. For that purpose, different
signal-scaling approaches and strategies are employed for data manipulation.
The following is a description of how prior oligo fingerprinting studies
have processed the data to produce the hybridization fingerprints.
Hybridization fingerprints results have been generated by transforming the
hybridization signal intensity data into three discrete values 0, 1 and N,
where 0 and 1, respectively, specify negative and positive hybridization
events and N designates an uncertain assignment. The signal intensity data
from the unidentified DNA clones were transformed into 0, 1 and N based on
the signal intensities from control clones, which are clones with defined
nucleotide sequences and from measurements and scaling transformations among
all measured hybridization events on the entire surface of the chip. For
most oligo probes, the control clones expected not to hybridize with the
probe (negative controls) have signal intensity values less than the control
clones expected to hybridize with the probe (positive controls); conversely,
the signal intensity values from the positive clones are higher than those
from the negative clones. For probes that function in this manner, clones
with intensity values ≤X were
given a 0 classification, where X is
the highest intensity value generated by a negative control. Clones with
intensity values ≥Y were
given a 1 classification, where Y is
the lowest value generated by a positive control. All other clones were
given an N classification. For some probes, not all of the control clones
perform in the predicted manner; for example, some positive control clones
may have intensity values that are lower than some of the negative control
values and vice versa. For probes that function in this manner, clones
with intensity values <X were
given a 0 classification, where X is
the lowest intensity value generated from a positive control. Clones with
intensity values >Y were
given a 1 classification, where Y is
the highest value generated by a negative control. All other clones are
given an N classification. Performing this analysis with all probes for all
clones creates a hybridization fingerprint for each clone. An example of a
hybridization fingerprint created by 26 probes is
000101N001000N110101111000. This is actually a bit simplistic explanation,
because the real data processing calculation is by far more complicated
involving scaling, rank-scaling and data reconstruction to account for
various signal-acquisition- and experimental variabilities.
Computationally, hybridization-signal matrixes are constructed where
the DNA-clones are the horizontal lines of genetic sequences (encoded by the
nucleotides represented by letters A, T, C and G). The random occurrences of
a single non-unique oligonucleotide (oligo) probe, are marked by the dotted
vertical lines. If the oligo probe as an example occurs 3 times along this 7
clones genome section (1), its
occurrence vector is digitally represented as (1,1,0,0,1,2,0).
Under experimental conditions eliminating the hybridization noise
(miss-match discriminating condition), oligo probe occurrences determine
positive oligo-probe hybridizations. In such a case the
hybridization vector of
the probe is going to be (1,1,0,0,1,1,0).
The
hybridization finger-print
of a clone is the row in the hybridization matrix corresponding to the
hybridizations of all oligo-probes with the particular clone – combining
their (oligo) sequences and hybridization signal values. Overlapping
clones are likely to have similar fingerprints, and this fact is the basis
for the recovery of the clones’ relative positioning among the genome, i.e.
genome mapping (by reconstructing genome contigs).
In realistic scenarios, the level of experimental noise can result in
both false-positive hybridizations (hybridization-detection with no
oligo-probe occurrence), and in false-negative hybridizations (oligo-probe
occurrence with no hybridization detected). Nevertheless, Bayesian
statistics can still be used to identify overlapping clones, provided a
sufficient number of probes is used. Moreover, certain computational and
experimental techniques can produce significant level of detection accuracy
and false-signal discrimination, for example by applying scaling and
rank-scaling measurements of signal-to-noise rations.
Our
methodology approaches and procedures were precisely optimized and tested,
and a small-scale experiment was performed with 20 chip replicas each
containing 27,500 cDNA clone fragments from human infant brain cDNA library.
A ½ of a real hybridization result is shown below with signal-data
visualization from a small row-sector as an example how data are accumulated
before computational processing (Figure 8).
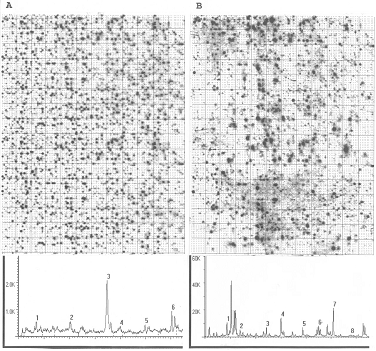
Figure 8.
DNA chip images on a high-density nylon membrane array (31104 dots; 1/2-part
of the image presented) obtained after hybridization with oligonucleotide
probe (GCTCATCGTC) and a corresponding signal diagram, presenting the
signal-intensity vs. clone-position relation - obtained from a measurement
of a small part of only one row from each of both images from the same chip
hybridized. Image A shows a
membrane image after 4 hours exposure at 4°C; image
B - after 14 h exposure; the
longer detection exposure – the less signal noise interference is detected.
All numbers indicated show some of the areas with highly positive cDNAs
hybridized with the target oligo shown.
K indicates 1000 cpm. The grid
and small points were created after a computational measurement and
optimization of the image by “DOTS” program (created by Jonathan Jarvis)
designed for better signal alignment, dots'-position visualization and
2-dimentional separation.
Why Oligo-fingerprinting is an Excellent Technique
Physical mapping using relatively non-unique
oligo probes shares the advantages with the popular mapping techniques –
that the use of unique probes offers much simpler experimental handling
requirements, as well as the ability to analyze many DNA clones in parallel.
It also enjoys the discrimination accuracy of DNA
repeat-sequences oligos compared to the standard gel-based
fingerprinting (sequencing). Its advantages over mapping with completely
unique probes include: 1) Both the oligo-probe computational
generation and its commercial synthesis is straightforward and much cheaper,
2) The number of oligo-probes required for the fingerprinting /mapping
experiment is independent of the genome size and genome complexity, and 3)
The informational-content output of each oligo-hybridization experiment is
much higher
-
because, in opposite, the overwhelming majority of unique oligo-probe
hybridizations to all DNA-clones in a library are negative. This approach
makes possible a very natural and efficient probabilistic interpretation
of the hybridization data, resulting in a strong robustness to experimental
errors. In addition, the introduction of limited number of short
perfect-match oligos, highly-specific to chosen known genes and/or
functional sequences, can serve as a precise detection and localization data
while reconstructing gene- and genome contigs
-
as well as to yield additional mapping and functional sequence data for the
DNA-library investigated.
The Standard Scenario
In computational simulations we defined a
standard scenario with
genome DNA-clones of length 40960 base pairs, in a genome of a length
represented by 25 clone-lengths (totaling in approximately 1 million base
pairs) and a coverage of 10. The simulated noise chosen included 20% false
negatives (probability of a probe occurrence not to cause hybridization),
and 5% false positives (probability of hybridization independently of probe
occurrences). 500 specific oligo probes of length 8 (8-mers) were used.
Based on the results of 1000 simulations in the standard scenario,
the algorithm achieves probability
of 96.1% of making no big errors whatsoever
(defined as over-clone-size positioning errors between
consecutive clones). The probability of making an over-clone size error
between any two clones, not necessarily consecutive, was estimated at 7.5%.
The average positioning error was 1740 base pairs (in clones of length
40960), and it can be further reduced using finer quantization in the
algorithm, at some computational cost.
Real DNA Sequences
Real
DNA is characterized by very-uneven base pairs distribution. As a result,
most randomly chosen oligo probes occur only very-infrequently, whereas some
probes occur extremely frequently. Therefore, practically, most probes will
hybridize with hardly any DNA clones, or else
-
with almost all of them. Such hybridization fingerprint data may almost be
completely useless. This is the scenario only, if the oligonucleotide
hybridization is used for precise and complete sequencing. Indeed, with
human DNA and 500 random 8-mers all constructed maps contained numerous
errors. Variety of researchers have done vast amount of research
investigation in this area during the past 20 years.
The solution to this problem
lies in a judicious choice of probes – of their sequences, size, and
total number to be used in oligo-hybridization experiment.
The basic idea is that the probability of some
oligo probe occurring
on different regions of the same organism DNA is highly correlated and can be
computationally investigated a priori. The first step is to use some already
sequenced part of the organism's genome to estimate this probability for all
possible probes of a certain length (this is achieved by the computer in a
matter of minutes) that can be chosen from that particular genome sequence.
Based on the obtained data, can be prepared a database of
"good" oligo probes,
which hybridize with about 50% of all DNA clones, and thus contain
maximum overlap information. Our computational results with 500
pre-selected 8-mers were that 12% of all constructed maps were
error-free.
While
the result with pre-selected probes is already
accommodating, it still needs
improvement. The basic problem is, that while most of the pre-selected
probes proved to be "good"-coverage probes for the physical mapping of a
target genome, some experimentally proved to be very "bad" ones, and these
where in fact numerous enough to confuse the algorithm analysis precision.
In order to overcome this problem, we tried
post-experimental selection
of oligo-probes
-
by monitoring the total number of hybridizations and the performance of a
particular oligo-probe and each of all the chosen oligo probes. In a
hybridization experiment, about 250-300 post-selected probes remained
performing well
-
out of the all 500 pre-selected ones. In the case of the Human DNA analysis
experiment, 80% of the resulting maps were error-free. The fact that this
result is better than the results with using large-size synthetic DNA
probes, is explained by the fact that our criteria for "good" hybridization
probes were more stringent than the range for random probes in synthetic
long-size DNA-probes hybridization. Indeed, if post-selection is used also
on long-size synthetic DNA
-
the error rate goes down to zero as well.
Example for Genome Analysis Approach for Oligo Probe Design
In a weeks-long experiment in 2003 using a super-computer, we analyzed the
entire GenBank sequence data from all deposited genomes for the
sequence-distribution of all possible oligos of the size from 8-mer long up
to 24-mer long. Because we wanted to obtain information how the size of an
oligo chosen corelate with its sequence representation among entire genomes
data, regardless of the species it represents. Such results allow for
choosing best oligo probes to be used in fingerprinting experiments
regardless of the genome probed on (i.e. equally-important for all sequenced
genomes and species). The result summary from this experiment is given
below.
Table 2.
Oligonucleotide n-mer analyses for the oligonucleotide distribution among
GenBank database sequences (as of 2003). The first data gives the raw data.
The interpretation of the number 754 in the "2" column of the 10-mer row is
-
that there were 754 distinct 10-mers that occurred in 2 distinct clusters in
the hs.seq.all data set provided by GenBank. The "effective size" number is
an estimate to the total
number of n-mer occurrences within the total sequence data. Intuitively,
this assumes
that and n-mer may have only limited occurrence per gene, which is why the
representation number in the cluster-column under cluster-size “1” increases
with “n” increase from 8 to 24 – because cluster-size “1” calls for single
representation among
the genome data. So, among the Gen-Bank data from 2003: there are only 323
of all
possible 10-mer oligo sequences represented uniquely (only once) among all
known
gene sequences deposed in GenBank, but 14,482,1196 of all possible 24-mer
oligos are unique. On the other hand – there is no 8-mer oligo sequences
that are uniquely existing in any of all deposited sequences in GenBank, so
all the 8-mers exist in multiple occasions in all known genes, in fact, any
8-mer occur in more than 10 occasions among GenBank known genes. T
Figure 9.
Occurrence probability distribution of defined n-mer nucleotides in GenBank
sequences – it shows the percentage of oligo distribution based on the
effective size and demonstrates, that multiplicity of distribution matters.
In the Table,
it is shown, for example, that
uniquely occurring
12-mers
are as rare,
almost as rare are
multiply-occurring
24-mers.
A drawback of all of these approaches is that one must carefully choose, in
advance, which type of sequences to probe. As a result, revisions
to the arrays for correcting mistakes or incorporating new genomic
information are costly, requiring arrays to be redesigned and
re-manufactured.
It is quite desirable to have a universal gene expression chip that
is applicable to all organisms, from bacteria to human, including
those that lack complete cDNA libraries or whose genomes are not
yet sequenced.
One way to obtain universality is to synthesize a combinatorial n-mer array
containing all 4n possible oligos of length n, the
key problem being to find a value of n that is large
enough to afford sufficient specificity, yet is small enough for
practical fabrication and readout. Combinatorial n-mer arrays can
be fabricated in a small number of simple steps using
conventional solid phase synthesis chemistry and arrays of
parallel fluid channels in perpendicular orientations to mask the
reagents as manufactured by Affymetrix company.
Until high-resolution, non-optical readout methods become practical,
microarray densities, however, will be constrained by the optical
diffraction limit. With this lower bound of ~0.28 µm on pixel
size, n-mer arrays are limited to 8×10⁹ distinct spots per square
inch, corresponding roughly to a 16-mer array on a 1" × 1" chip.
Although it is possible to fabricate arrays with larger areas, we
consider here arrays whose size (1-3-inch rectangle) is comparable to the
current state of the art to facilitate sensitivity comparisons.
Therefore, we address the question of whether one can extract
useful gene expression information from combinatorial arrays of
short (i.e., n
Good practical approach to optimize the hybridization performance of the
oligo-probes is using longer-size so-called “degenerated” oligos containing
the nucleotide base inosine (I) that lack pairing (complementarity)
specificity but improving the hybridization-duplex stability without
influencing the hybridization specificity of the middle oligonucleotide
“core”. For example, it is statistically known that 65,536 are all possible
8-mers (48) to cover the entire genome, however it is practically
impossible to achieve experimental conditions under which perfect-match
discrimination results can be generated for all of the oligonucleotide
sequences due to the specific experimental requirements. However
reasonable compromises can be achieved in optimization of the hybridization
conditions with an optimization in oligo size increase (up to 15-17-mers)
and inosine “degeneration” of the oligonucleotide ends leaving the core
sequence intact.
A
similar strategy exploring long oligo probe approach is presented by
Joseph DeRisi
in a video we are recommending here below – for better visual explanation.
We have to note, however, that the long-oligo approach described in
the video is very-remotely similar and allows for very modest scale in
gene identification by oligonucleotides – so much so, that on our
opinion it is practically unsuitable for large-scale fingerprinting, nor for
practical and precise gene identification. In its format, it can only
serve as an example for an oligonucleotide-based genetic identification
approach.
ð
Genome Sequencing for Pathogen Discovery - Joseph
DeRisi (UCSF, HHMI)
(https://www.youtube.com/watch?v=2LPfWuKBN_o).
DNA-clone specific signatures (finger-print codes) can be created for
each clone of a solid-support arrayed library - by using even only 200 or
more specific oligonucleotides or oligonucleotide-contained DNA- or
RNA-fragments after their strong complementarity annealing to their
corresponding target sequences via nucleotide hybridization (Figure 8). In a
mirrored-type format, short oligonucleotides can be arrayed onto micro- or
macro-array containing up to tens- or hundreds of thousands of short
oligonucleotides of a size from 7- to 17-mers and hybridized with labeled
DNA- or/and RNA pools originating from known, unknown and mixed organisms’
sources. Based on the hybridization data obtained at experimental conditions
discriminating perfect-hybridization-match from a hybridization miss-match,
followed by computational analysis, the previously unknown genetic-sequence
fragments under investigation are successfully clustered and sorted
according to their computationally-reconstructed sequence contigs (yielding
un-interrupted sequence information). This strategy was named genetic Clone
Fingerprinting and Recognition by Oligonucleotide
Hybridization (CFROH). It consists of two steps: First, creating
oligonucleotide-based clone-specific codes (fingerprints). Each
gene-fragment
fingerprint-code is generated as a result of the
oligonucleotide hybridization process between a vast number of
oligonucleotide probes with known sequences (as specially designed and
chemically synthesized) and the gene fragments with unknown genetic content
(generated from a biological source).
Thereby the clone (DNA) oligo-fingerprints include: the
total number
and the corresponding primary
sequences of all the positively annealed oligonucleotides (initially
designed as within the range of 4-50 bases long), and the value
(magnitude)
of the hybridization intensities
of the detected strong-annealing
(hybridization) signal. Second, a
comparison of this clone fingerprint to the analogous, computer generated
“recoding” of the gene bank data bases, does generate a level of clone
recognition. This is an oligonucleotide-code based clone-recognition or
CFROH (or shortly
-
oligonucleotide fingerprinting) (Figure 10).
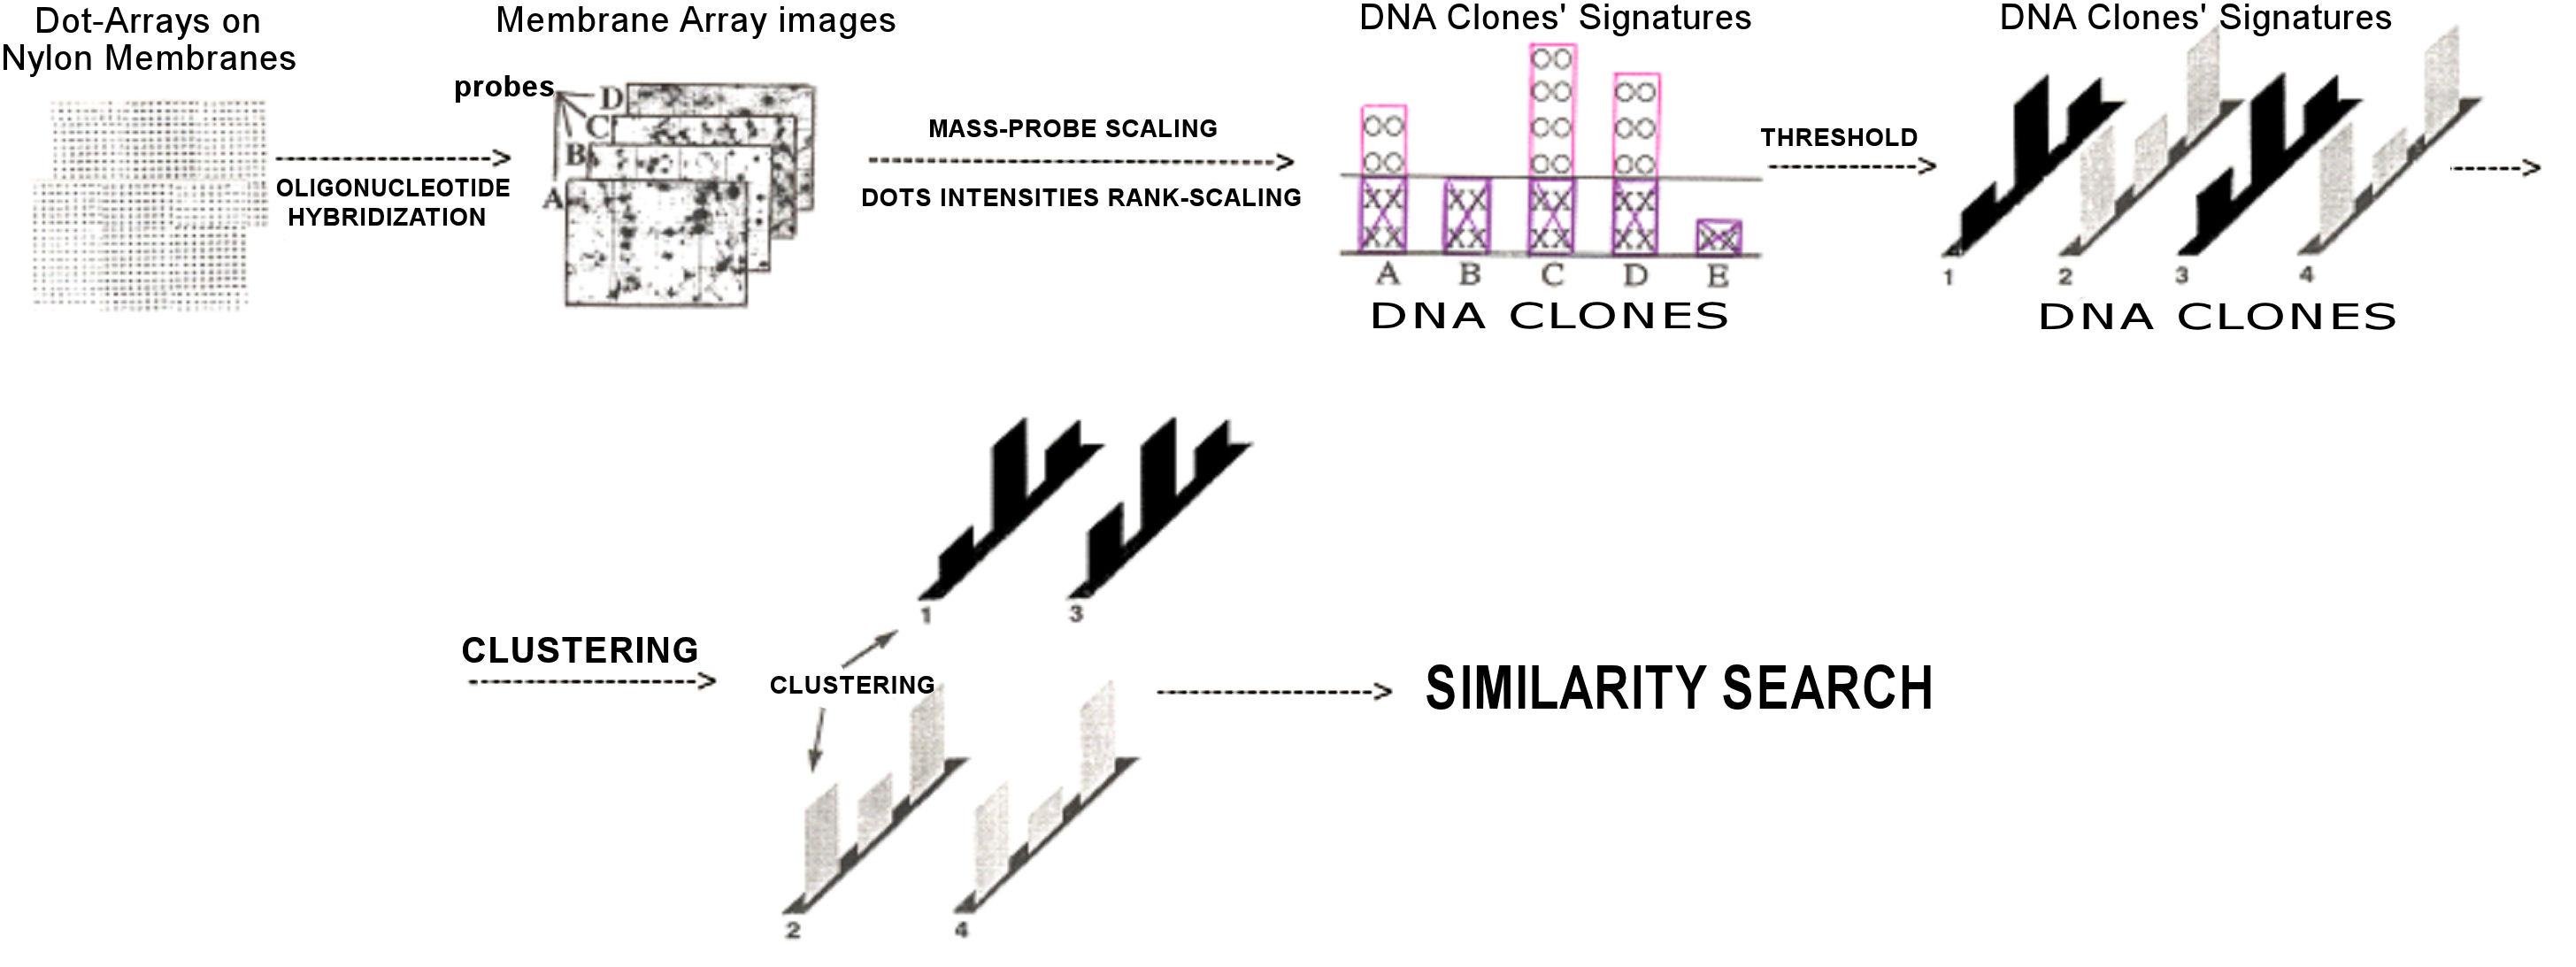
Figure 10.
CFROH processing and analysis steps.
The
original idea is the RECODING of the naturally-existing nucleotide-coded
genetic information into an OLIGO-nucleotide based “code”. The basic
reason for this approach procedure is the goal to reduce the total number of
DNA- (RNA-) fragment specific signatures (naturally occurring as a
nucleotide code) to a relatively much lower number of specific signatures
(i.e. finger-prints) given by oligonucleotide hybridization data
(occurrences & signal values), which as a result would demonstrate an
ability to compare and recognize gene-fragments existing among unknown
gene-fragment pools and genetic data-bases without the need for time- and
resources-consuming precise sequencing of the entire genes and genomes. The
critical importance of this strategic approach is most valuable for
accessing genetic information within mixed libraries containing genetic
clone-fragments generated from mixed population sources – usually serving
large-scale detection-, diagnostic-, and monitoring purposes, especially in
bio-pathogen detection and identification. So,
for
gene identification and analyses, we use oligonucleotide-based
fingerprinting instead of complete gene sequencing.
The above approach provides both: significant decrease of all
sequence-determination work, necessary for gene (-fragment) clone
recognition and characterization, and possibility for complete gene-library
characterization (DNA- or RNA-based) – each separated clone will obtain
specific oligonucleotide-hybridization-based “fingerprint” code. As a
result, it opens the possibility for a new level of gene marketing, that
permits the sale of already separated and semi-characterized DNA-clones with
completely or only partially knows genetic sequence without complete
sequencing and deep resource spending.
Creating of a clone-specific signatures (code) by oligonucleotide
hybridization.
Up
to 31,000 cDNA-clones were arrayed onto a nylon membrane creating a chip
(micro-array) of DNA fragments’ sequences. So, a cDNA-library of separated
cDNA-clone fragments was created, which included a physically separated
cDNA-clones each expressed in E. coli
cells, their corresponding PCR-amplified inserts, and the inserts cDNA
arrayed onto the nylon membrane (Figure 8).
At the first step of
analyzing we obtained hybridization data, a DNA clone-dot concentration
calibration and molarity-amount measurement on all chips (replicas)
hybridized with approximately 200 oligos of defined and pre-selected
sequences. Here are two
important venues. First: The relations between molarities of all
cDNA-clones dotted on each membrane-replica can be estimated in the
hybridization step with an oligonucleotide, the complement of which is known
to be presented in all PCR-products (so called mass-probe). This
oligo usually is designed as a complement to the sequences placed between
the PCR primer(s) and the foreign (cDNA) insert. If onto the membrane-filter
are dotted controls with serial dilutions of the vector-DNA of known
concentration, precise measurement and calculation of the molarities of all
clone-dots is not a problem. This calculation and molarity measurement is
very important for the future measurement and calculation of the
hybridization intensities of all the cDNA-clones arrayed on the membrane –
it allows to discriminate precisely the positively-hybridized cDNA-clones
from semi-positive ones and the negative-hybridized. However, this type of
measurement is not sufficient enough because each of the hundreds of
oligonucleotide hybridization probes have not only different "affinity" to
the cDNA-target than the mass-probe, but also because it is possible to
hybridize to more than one target-site within the same cDNA-sequence – so it
is necessary to measure the relation between the hybridization-intensity and
the target-site molarity in each specific case of oligonucleotide
hybridization event detected. Second: Additional strategy for
target-site molarity measurement was developed. It includes arranging (on
the membrane) repeatedly-spotted control dots of serial dilutions of
specific complementary-oligonucleotide mixtures (containing
non-self-complementary oligos) and also dots of serial dilutions of several
very long (cosmid-DNA) fragments with known concentrations (pre-measured).
The presumption is to have a control-representation of the complement-target
of each possible oligonucleotide-prove used as a hybridization probe – so to
be able to measure the target-molarity in each hybridization experiment and
to eliminate the influence of the specific hybridization conditions and
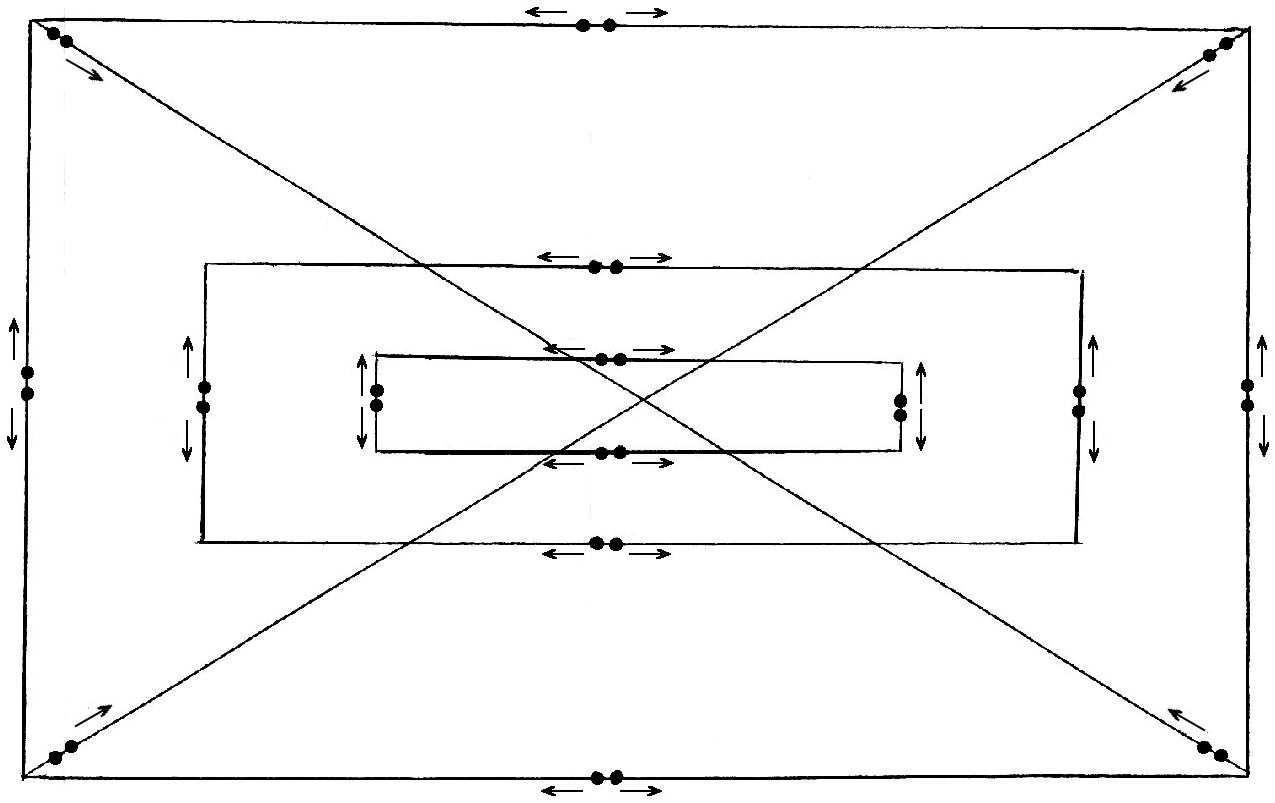
kinetics. Each control-target mixture should be printed at least as
neighboring duplicated dots each time and deposited evenly across the array
in a pattern similar to the one shown on the figure 11.
Figure 11.
Scheme of control dots distribution onto the membrane array. The
direction of the deposition of all repeats is shown with arrows.
The second step is a
computational measurement of each hybridization result (i.e. each
membrane-array image) (Figures 8 and 10). A custom program ("DOTS-program")
or similar one is used for a measurement of each cDNA-dot onto the membrane,
location of its precise coordinates among the pre-determined deposition
matrix and transformation of the hybridization intensities into their
numerical equivalent as a computer-generated signatures of the corresponding
cDNA-clones (Figure 10). At
this level the clone-specific code will be generated, consisting of: 1)
The total number of all positively hybridized oligonucleotide probes, 2)
the sequence of each oligonucleotide probe generating positive signal, and
3) the value of the detected hybridization signal as scaled among all
clones and membranes – the specific measurement serving this purpose is the
complement of the chosen oligo present in each particular clone
(mass-probes) and in how many copies it is present that is a measure for the
molarity relation between the oligonucleotide probe and it’s complementary
target site onto the corresponding cDNA. 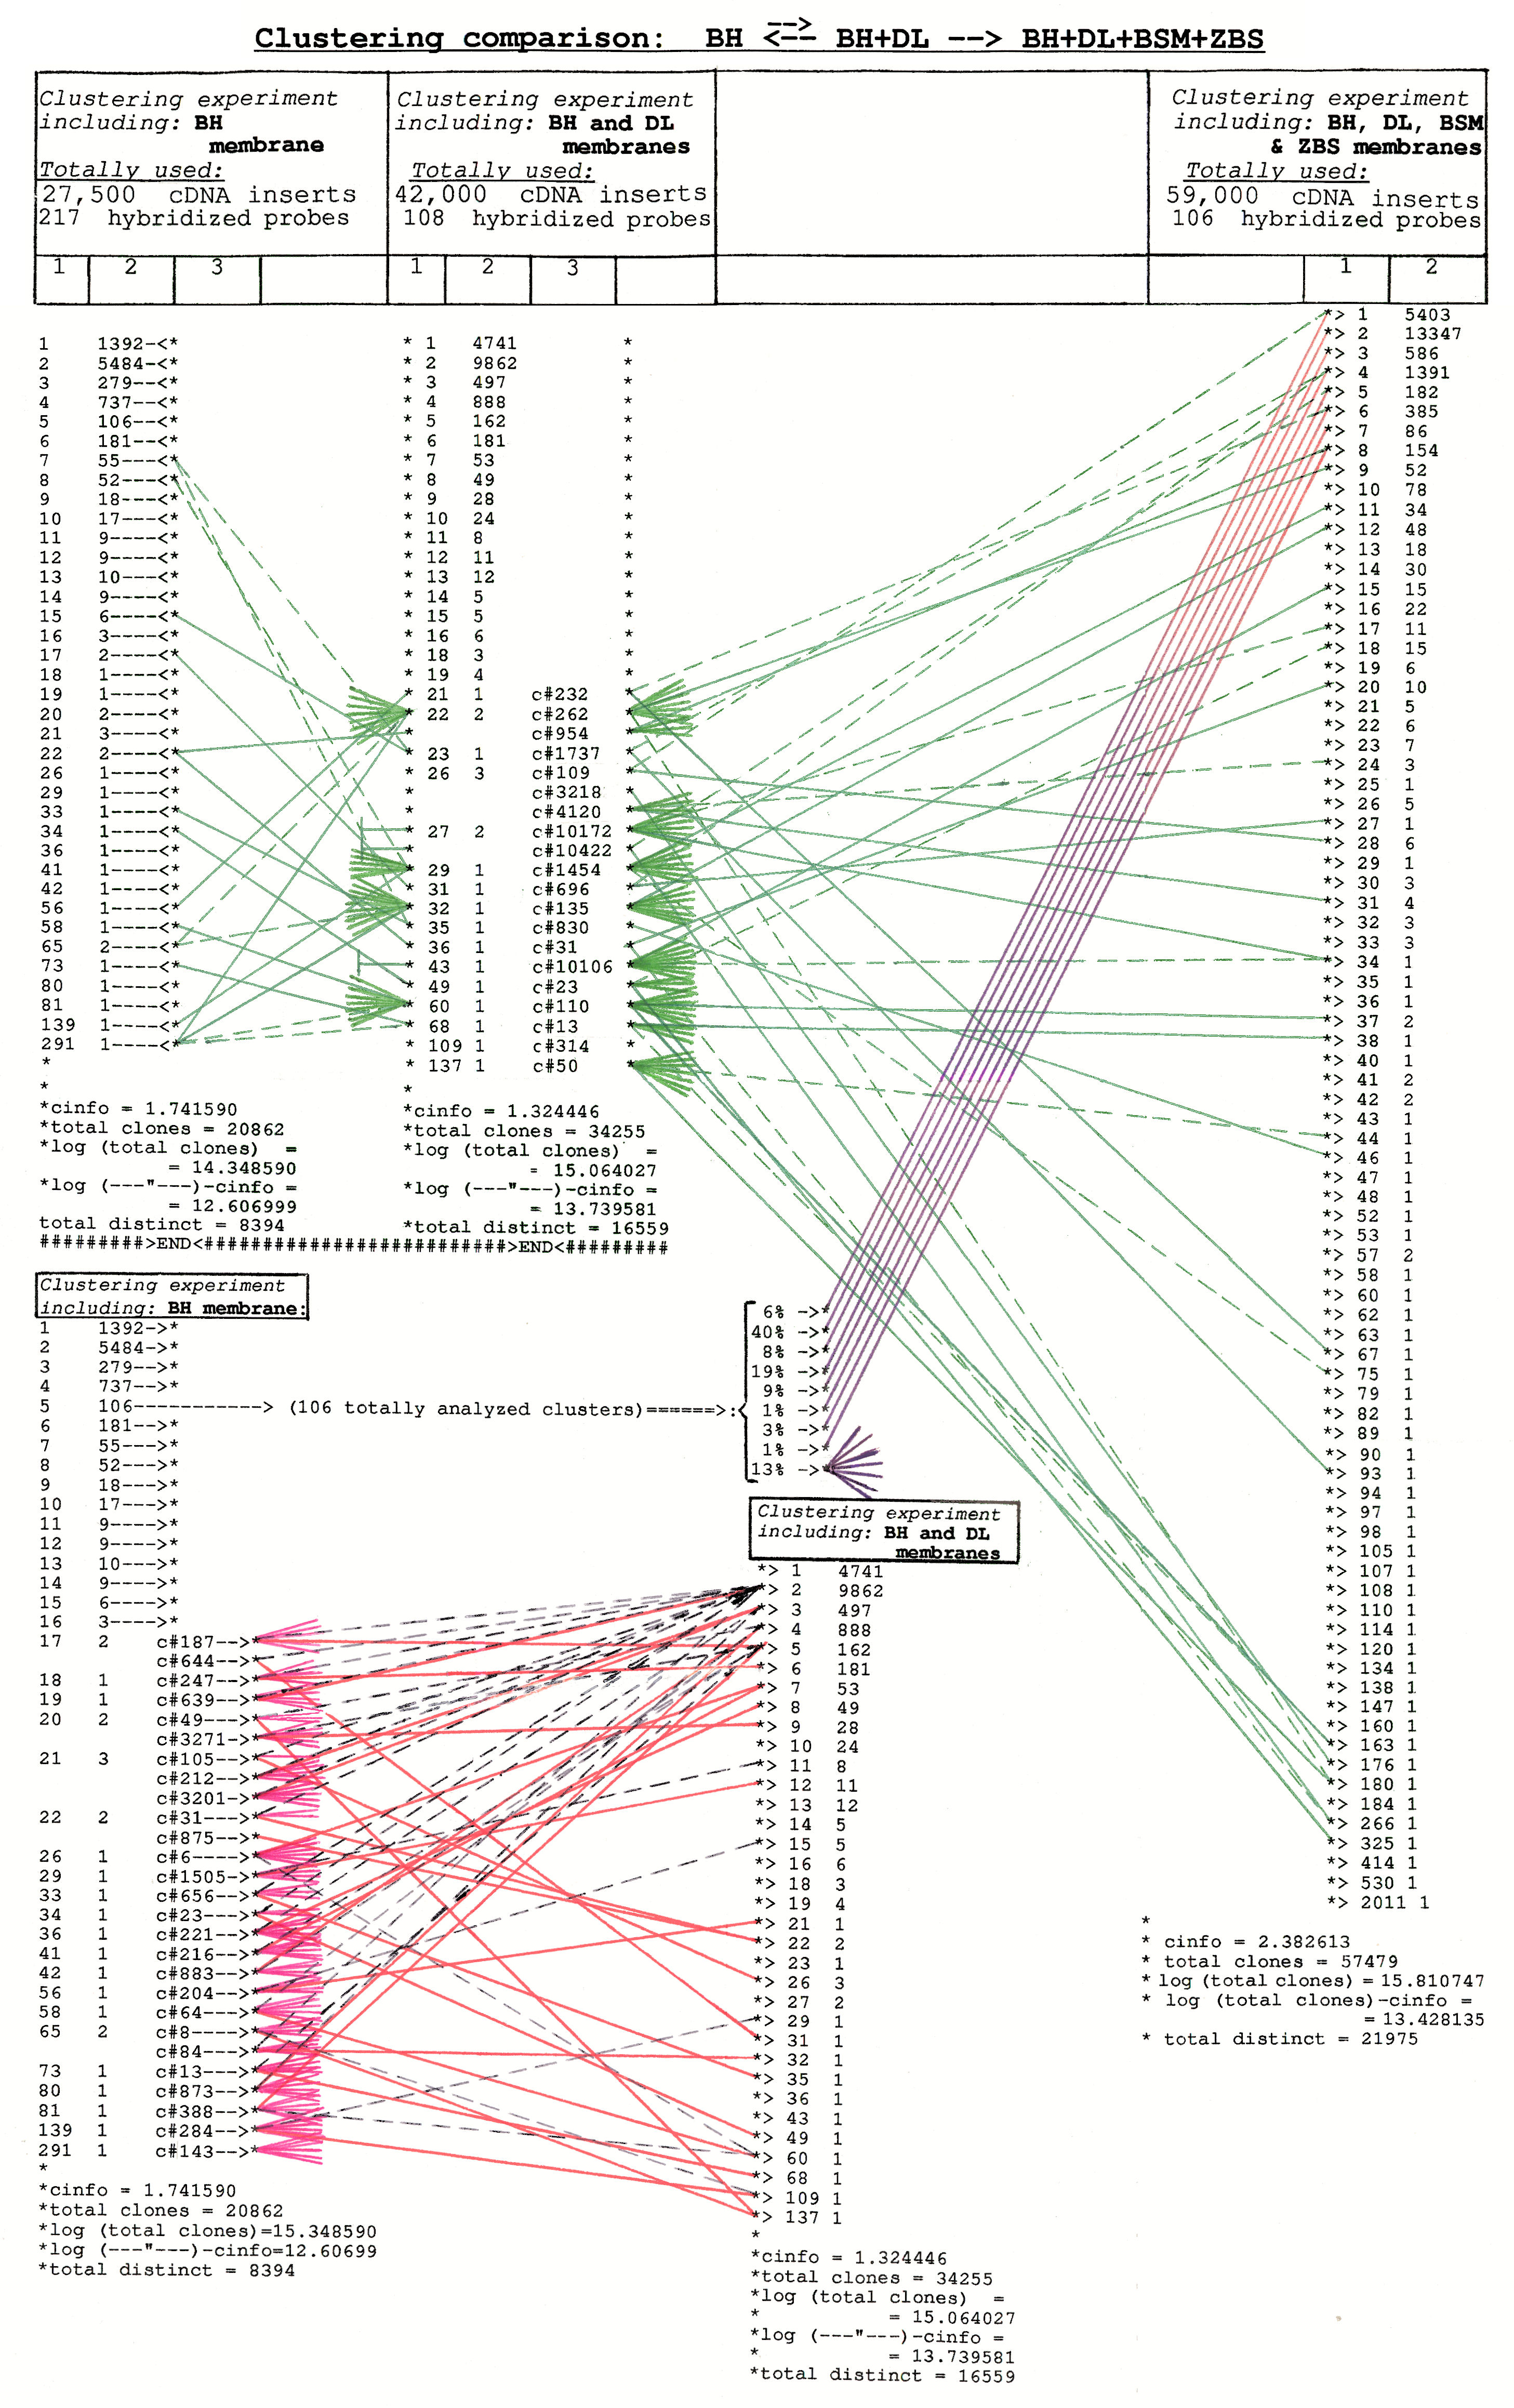
Figure 12.
Comparison of clusters and clustering results obtained from 3 different
clustering experiments – each containing different number of cDNA insert
fragments from normalized (subtracted) cDNA library only (spot-attached onto
DH-, DL-, BSM- and ZBS membrane arrays) and different number of
oligonucleotide hybridization probes. The type of comparison and the
computational clustering parameters are presented on the figure. Note, that
at the left of the table, columns #1 and #2 containing comparison data from
clustering experiments #1 (including BH - arrays) and #2 (including BH- and
DL arrays) – are duplicated (top-to-bottom) for better data visualization.
Scaling and Clustering of OSSs (Oligonucleotide
Sequence Signatures)
The
significance of similarity between a sequence and the oligo data-list was
determined by the
Algorithmic Significance method: For each cDNA sequence and a query
oligomer list was estimated how many bits of information about the known
sequence were revealed by the oligo-list hybridizations –
where every bit of information implies a two-fold increase in
significance value of the similar particular. Two parameters were
considered for each query sequence – the top-score with a particular
oligomer list, and the difference between the top-score and the
second-highest score, for which were assigned the terms “absolute” and
“relative” scores, respectively. A few inconsistencies among the results
(different cDNA-sequences matching the same cDNA-clone) were resolved by
taking the one with the highest absolute score.
At this point is hard to verify the real situation – as to how this
oligo-based clustering correspond to the real cone similarity – are the
clones of one cluster a real copy of the same- or a very-similar mRNA, i.e.
are the clustered clones of one computed cluster are in fact members of
genetically similar family of genes. To verify the accuracy of our
clustering methodology, an additional approach was used to investigate the
computational clustering data – 100 clusters were chosen to pick one
cDNA-clone, a member of each one cluster and the cone cDNA-insert was
hybridized as a probe against all another clones of the membrane (Figures
13, 14 and 15) in order to expose all really-similar clones out of the
approximately 31,000 deposed onto the membrane and included in the same
clustering experiment. Note, that the chip is prepared by the bottom-half
of each chip being identical to the top part; so, each DNA fragment is
attached twice on the chip (on the same row from the top to the bottom)
in order to serve as additional positive control – i.e. each DNA-fragment
signal should be detected as 2 replicas on the same chip and should produce
equal computational output result.
The result did approve all logic of the entire investigation – as less
oligonucleotide probes were used being included in the clustering
experiments, as less precise the clustering result was.
So, (on Figure 13) when 107 oligos were used in generating hybridization
data and in a clustering experiment, for some clusters all really-similar
clones were clustered in the same cluster, but higher percent of clusters
contained "mixed" clones. When 152 clones are used, some of the "mixed"
clones become to be members of the same "correct" cluster; however, in all
cases clusters contained more "ballast" clones, which were not detected to
be of the same group in reality by the clone–>clones
hybridization experiments. The above becomes as a logical result due to the
low accuracy in the technical design for molarity target measurement and for
hybridization intensities calculations used in this particular experiment
(with 152 oligo-probes). Very
successful become the clustering experiment including 217 oligonucleotide
probes and 31,000 cDNA-clones. Here we demonstrate final experimental data
for only 3 clusters and these data are really amazing (Figure 13 and figure
14): First, for a clone #1, recognized by partial sequencing to be an
analog to human Guanidine-binding protein mRNA (Figure 13). Four clones,
detected by self-hybridization to be members of a same cluster in reality,
were clustered in the same cluster in several clustering experiments, but
only if 217 oligonucleotide probes were used, the clustering is
absolutely correct – only the same 4 clones are in one cluster.
Second, for a clone #2, recognized to be an analog of thyroid hormone
mRNA (Figure 13). Two clones, detected to be members of the same cluster in
reality were clustered in different clusters, if 107 oligo-probes were used.
Clustering analysis with 152 probes separate them in the same cluster, but
contained many more "incorrectly" clustered clones. When 217 oligo-probes
were used, the clustering analysis become again absolutely correct – both
clones were separated within the same single cluster with no other clones in
it!
Moreover,
third clustering experiment (Figure 15, top; clustering with 107 oligo
probes at threshold value of 100) identified eighteen cDNA clones clustered
in 5 distinct clusters, but, when a
single cDNA-clone was used as a similarity probe, it hybridized positively
with 22 cDNA clones belonging to 5 different clusters establishing a high
order of sequence similarities between all of them (Figure 15, bottom).
Almost astonishingly, after a complete cDNA clone sequencing of single
members of each of the 6 clusters and a sequence analysis, we found that all
these DNA fragments did belong to different genes of a highly-similar family
of genes. In this case the oligo-fingerprinting analysis was capable of
highly precise clustering and gene discrimination –
over-performing the capability of standard DNA-DNA hybridization techniques
commonly used, with a performance close to the one of gene sequencing – as
good as desired by the a priori design of our oligo-fingerprinting approach.
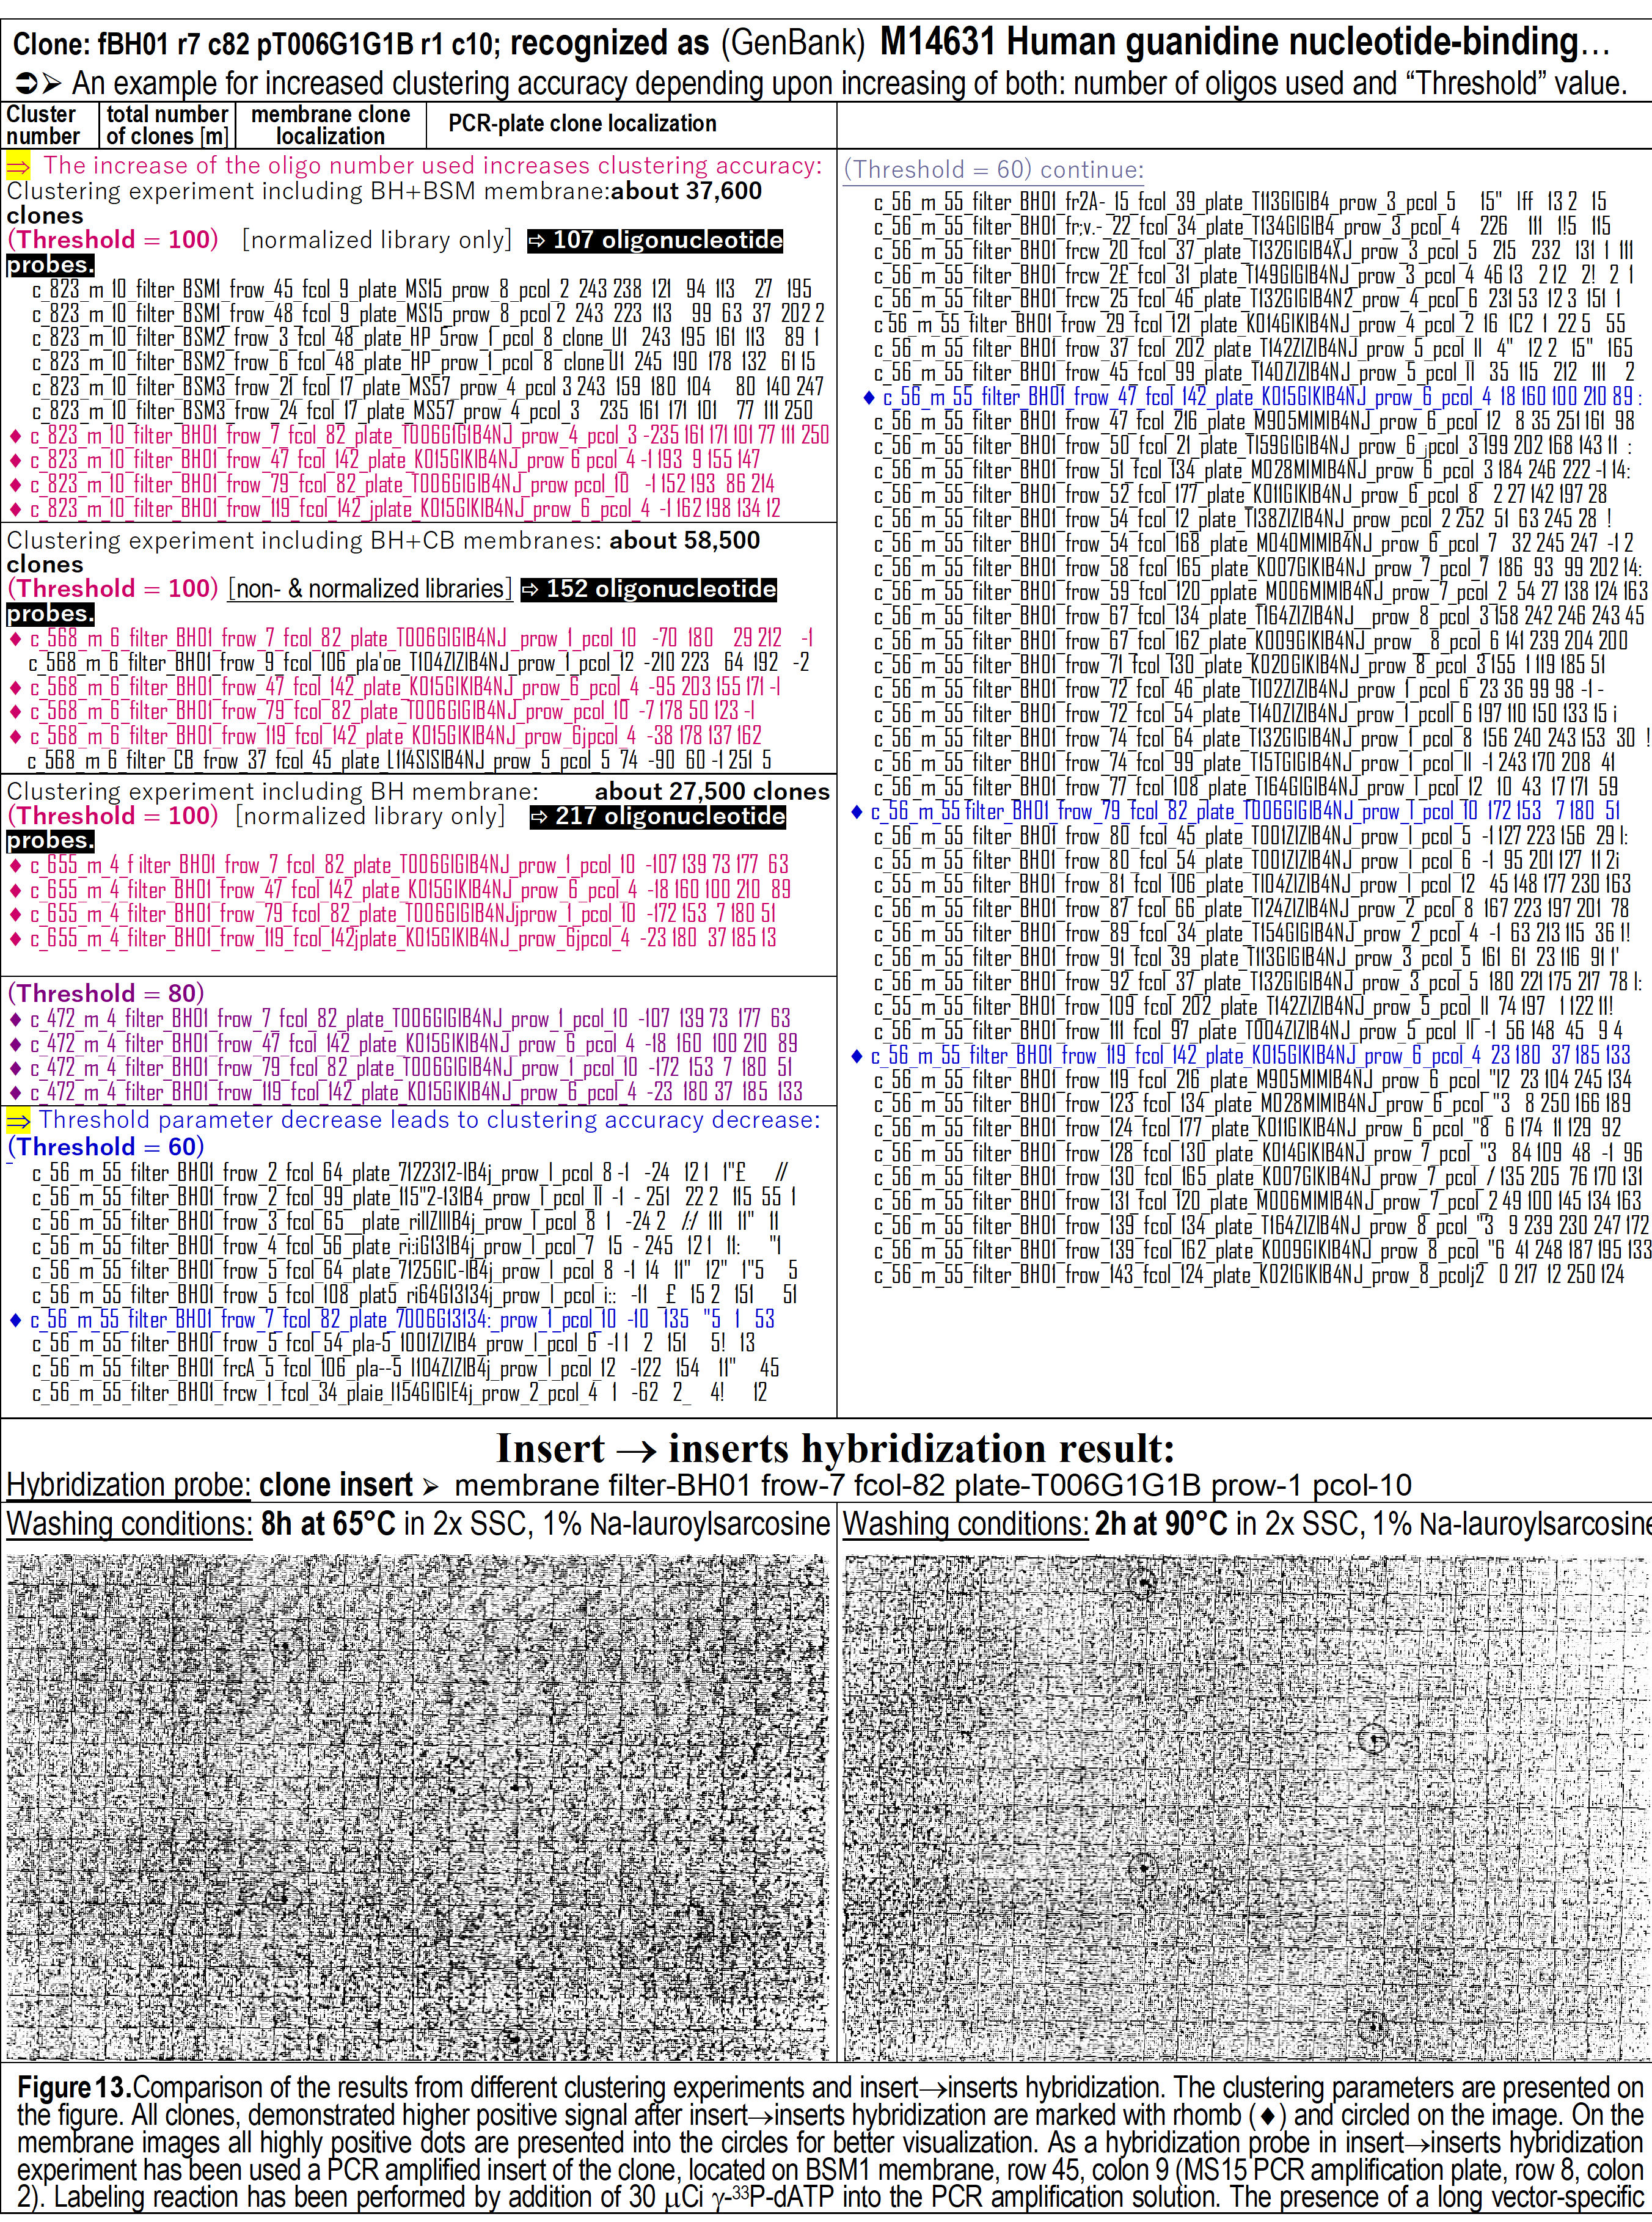
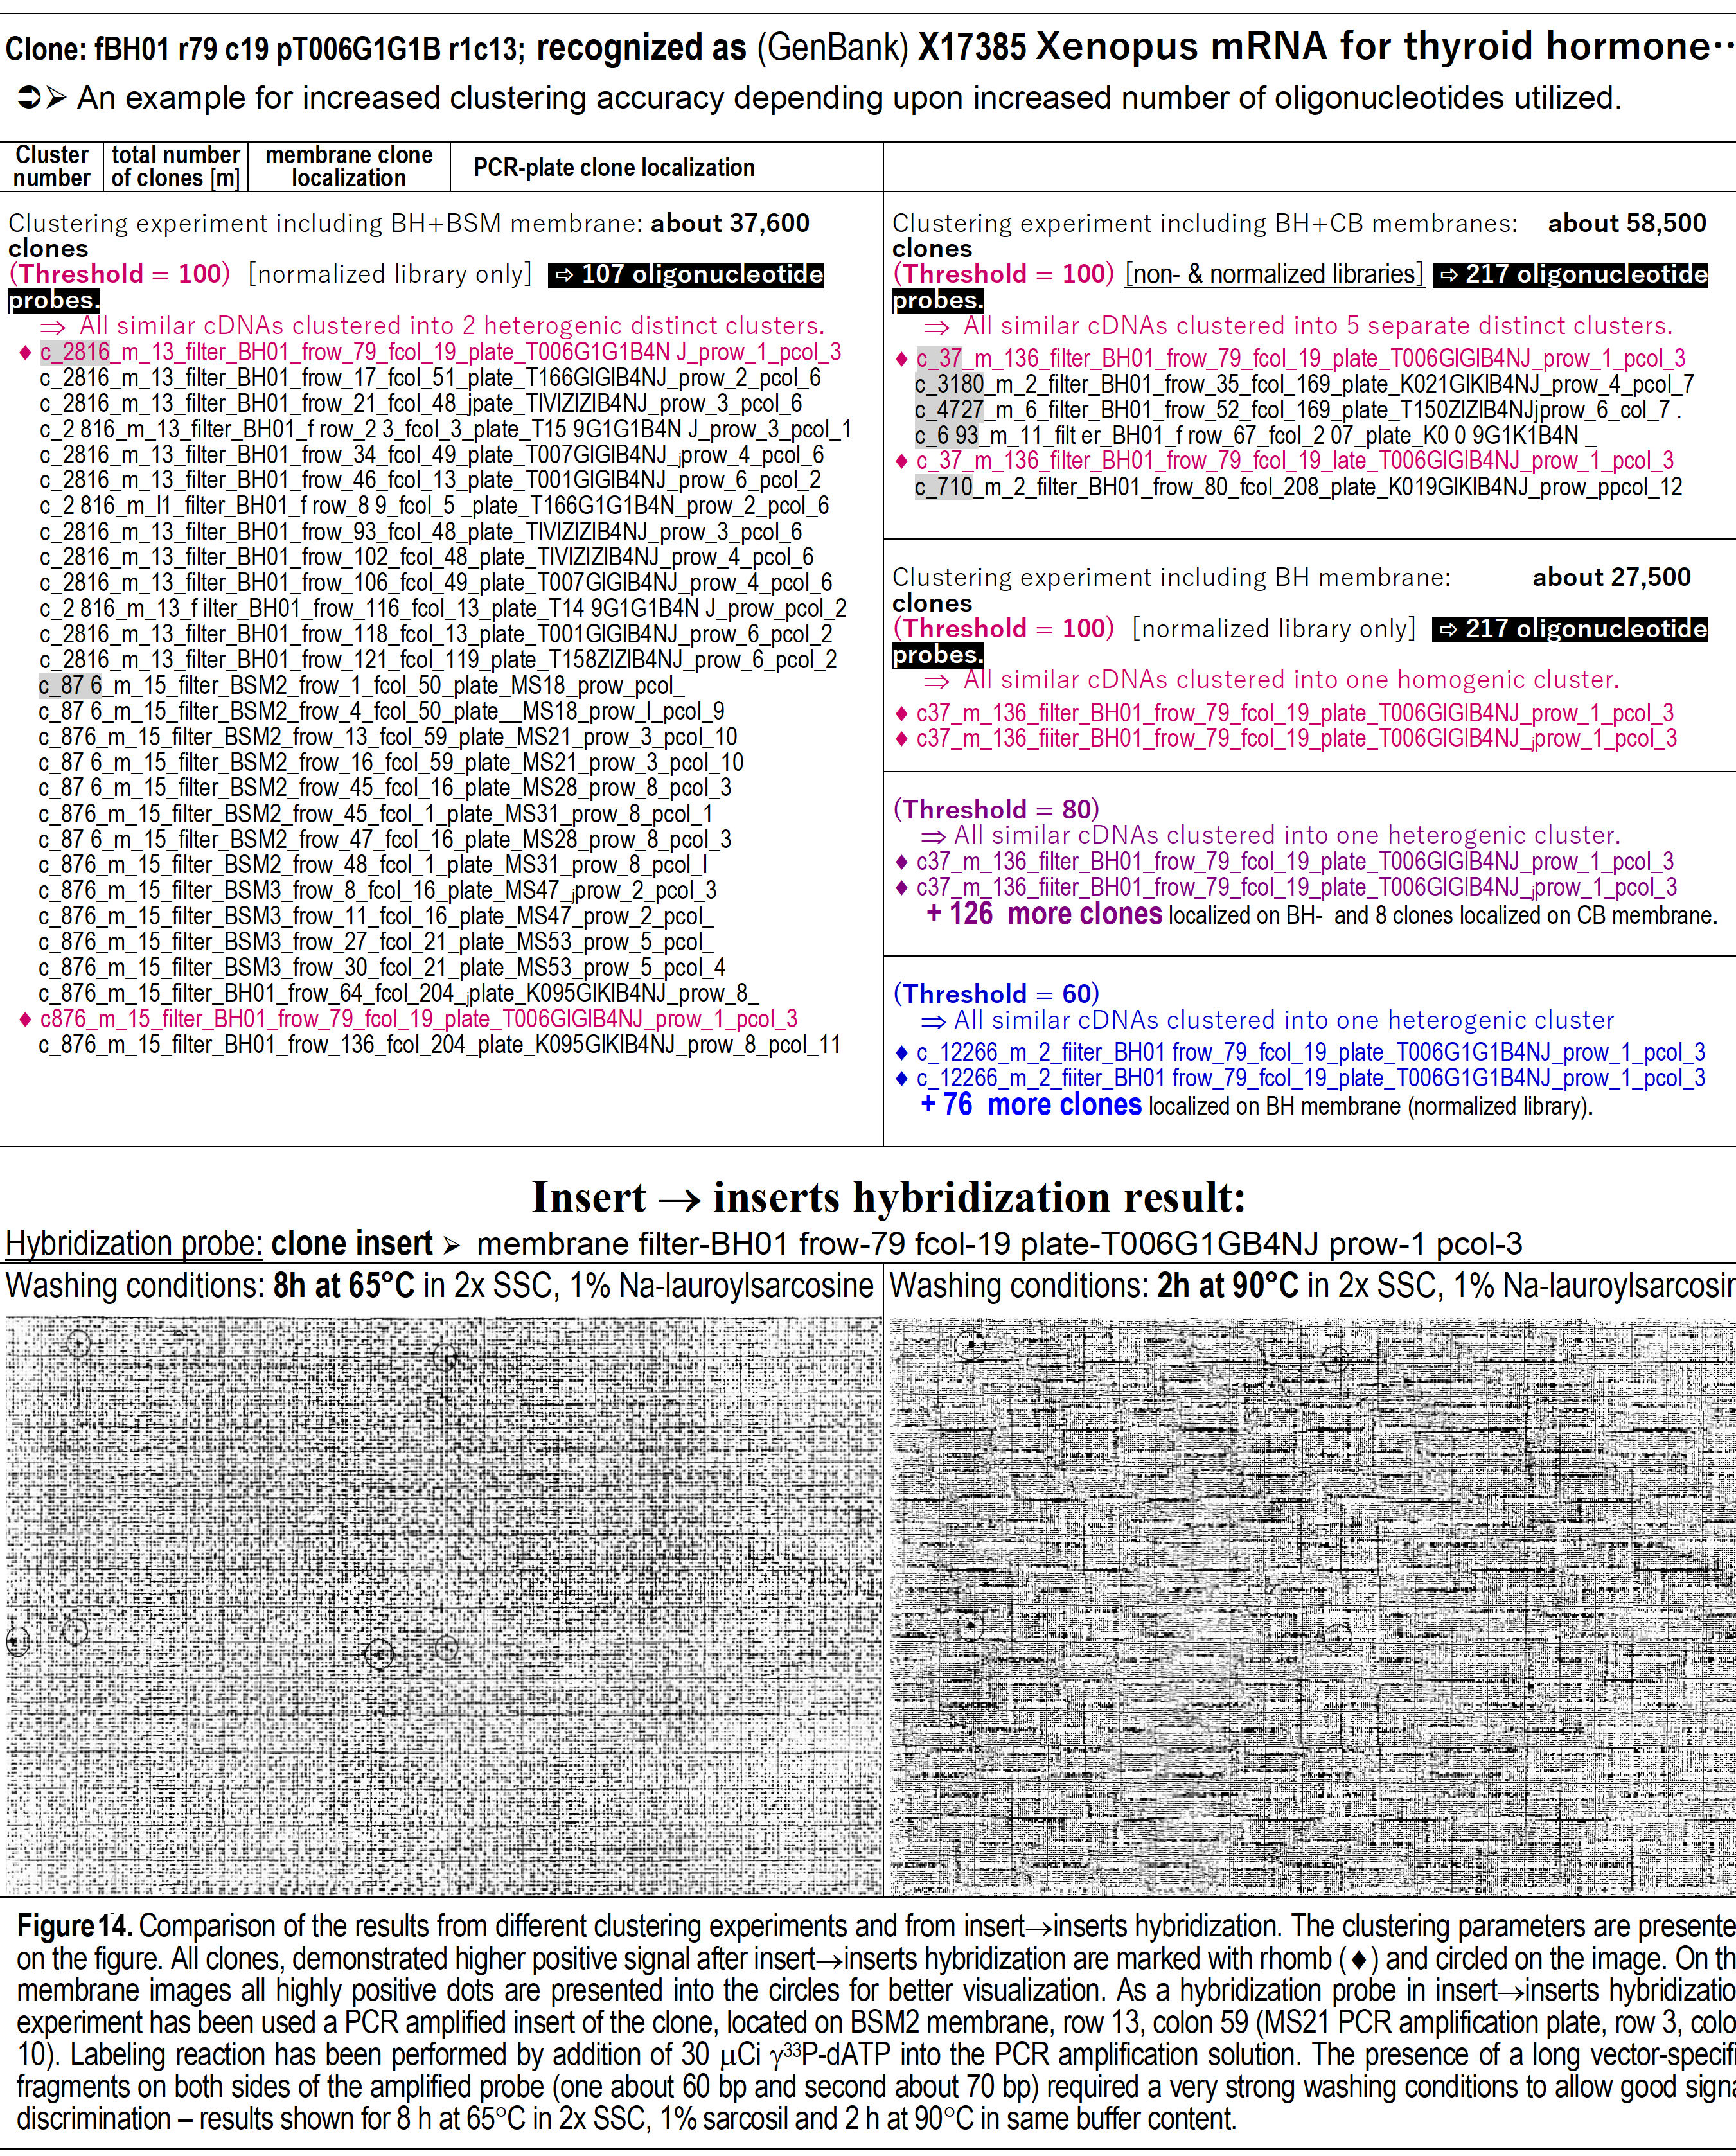
Figure 13.
Comparison of the results from different clustering experiments and
DNA insert"inserts
hybridization. The clustering parameter values are shown on the figure. All
DNA clones demonstrating highest positive hybridization signal (visible at
the bottom) are marked with rhomb (·)
within the table (at the top) and encircled on the images (at the bottom).
As hybridization probe in the insert"inserts
hybridization, was used a PCR-amplified DNA-insert of the clone located on
the BSM1-array at row-45, column-9 (from row-8, column-2 within the MS15 PCR
amplification plate). Labeling reaction was performed by the addition of 30
mCi
of
g-33dATP
into the PCR amplification reaction.
Figure 14.
Fingerprinting clustering analyses with 107 and 217 oligo probes at
threshold values from 60 to 100 (top of the figure) and DNA-fragment
hybridization with probe identified as GenBank “X1785 Xenopus mRNA for
thyroid hormone” against all DNA fragments attached to the chip (bottom of
the figure).
Figure 15.
Fingerprinting clustering analyses with 107 and 217 oligo probes at
threshold values from 60 to 100 (top of the figure) and DNA-fragment
hybridization with probe identified as GenBank “X03558 Human mRNA elongation
factor” against all DNA fragments attached to the chip (bottom of the
figure).
The results are very exciting, because they show, that entire cDNA clone
library characterization and precise fingerprinting clustering is
technically achievable and really applicable with relatively larger number
of oligonucleotide probes. The precision of the clustering, for example, of
only two DNA-clones out of 31,000 in a separated cluster, which was equal to
the reality existing situation, is an amazing achievement. In one other
case, the DNA-clone"attached-DNA
clones hybridization exposed (detected) only 4 DNA-clones assumed to be
really similar. (Figure 15, top). However clustering analysis
showed two of them in the same cluster and the other 2 were in another 2
different clusters (Figure 15, bottom left). It was really amazing, that a
stringent membrane wash (2h at 90°C)
eliminated them as members of the same cluster (Figure 15, bottom right;
note, that they are attached as top-to bottom replicas – i.e. exposed as 4
dots while being only 2 different DNA-clones – on the left and right on the
chip image)! The additional 2 DNA-clones visualized on the left chip image
(while absent on the image to the right) were very similar clones, but with
slightly different sequences and this high-similarity was nevertheless
discriminated by our fingerprinting approach proving to demonstrate
precision higher than the standard clone-clone hybridization experiment..
Unknown DNA Sequence Recognition Based Upon
Oligonucleotide Fingerprinting Results
The
cDNA clone sequences were identified by comparing the list of oligomers’
sequences that were identified to occur in them (by the means of
hybridization fingerprinting) against all known DNA sequences from GenBank.
For each hybridization signature (fingerprint) consisting of specific number
of hybridization intensities (signal values), a list was compiled –
consisting of the corresponding oligo-sequences demonstrating only
perfect-match hybridizations among all the 260 oligomer probes and
exhibiting the highest hybridization intensities. The list of all the 260
oligomers was augmented by the additional 260 reverse complementary
oligomers (because both strands of the PCR products were hybridized and the
orientation of oligomers against the genetic data could not be resolved) –
these served as additional sequence-data (and hybridization) verification
since both reverse-complementary DNA strands are present in the labeled
hybridization pool.
To
identify the most frequently occurring cDNAs, the clones from the original
Human brain cDNA library were clustered at high computational stringency (to
maximize sequence-homogeneity of clones within clusters) and a single
representative cDNA clone from the 100 largest clusters was selected for
further investigation. The corresponding 260-oligomer lists were used as a
database for searches using known DNA sequences as queries. A total of 195
searches involving gene sequences of average length of 2.5 kb were performed
against the database consisting of the 260-oligomer lists.
Usage of degenerative oligo probes and capability of discriminating genes
with extremely-high sequence similarities among large-scale DNA libraries
containing highly abundant gene transcripts.
The
“impossible dream” in the oligo-fingerprinting technology is achieving the
ability to discriminate and identify unknown genes of families with
relatively high abundance expressed at moderate levels from entire
organisms’ libraries. For example, ability to detect specific immunoglobulin
transcripts of unknown cell-clones between two different cDNA libraries
obtained from two closely-related genetic lines of laboratory animals and,
moreover, to discriminate between these highly-similar immunoglobulin gene
sequences based solely upon the oligo-fingerprinting results.
For
the purpose of testing our technology, we initially performed GenBank® similarity search and analysis to identify a very-short
regions within the immunoglobulin transcripts which would exhibit
gene-specific (unique) sequences – aside of the otherwise extremely-high
sequence similarity among all of the known immunoglobulins’ transcripts.
With another words, at the current time, no data was known to exist for
sequence variability of a chosen immunoglobulin gene or its mRNA gene
family, nor any investigation was well documented as to the level of its
transcription variability or the specific particular biological function
served. In order to investigate the capabilities of different
oligonucleotide designs and limited number of oligos to serve as
discriminatory and finger-printing tool, we designed and probed relatively
small number of degenerated oligos of sizes 13-mers, 15-mers, and 17-mers
and hybridized them with labeled cDNA from 2 very-close mouse lines – NZW
and NZBW – one consisting of healthy mice and another – exhibiting acute
renal failure.
This experiment proved
the exclusive capability of detecting single-nucleotide variation detection
and single-nucleotide-based discrimination in both – gene expression pattern
difference among very-closely related mammals and a single-type molecular
gene profiling of an unknown genetic content.
The oligonucleotide fingerprinting precision
was so high, that it led to correction of
the GenBank® sequence data establishing a
single-nucleotide deviation (or detected gene mutation) in the data submitted in
GenBank® by multiple investigators.
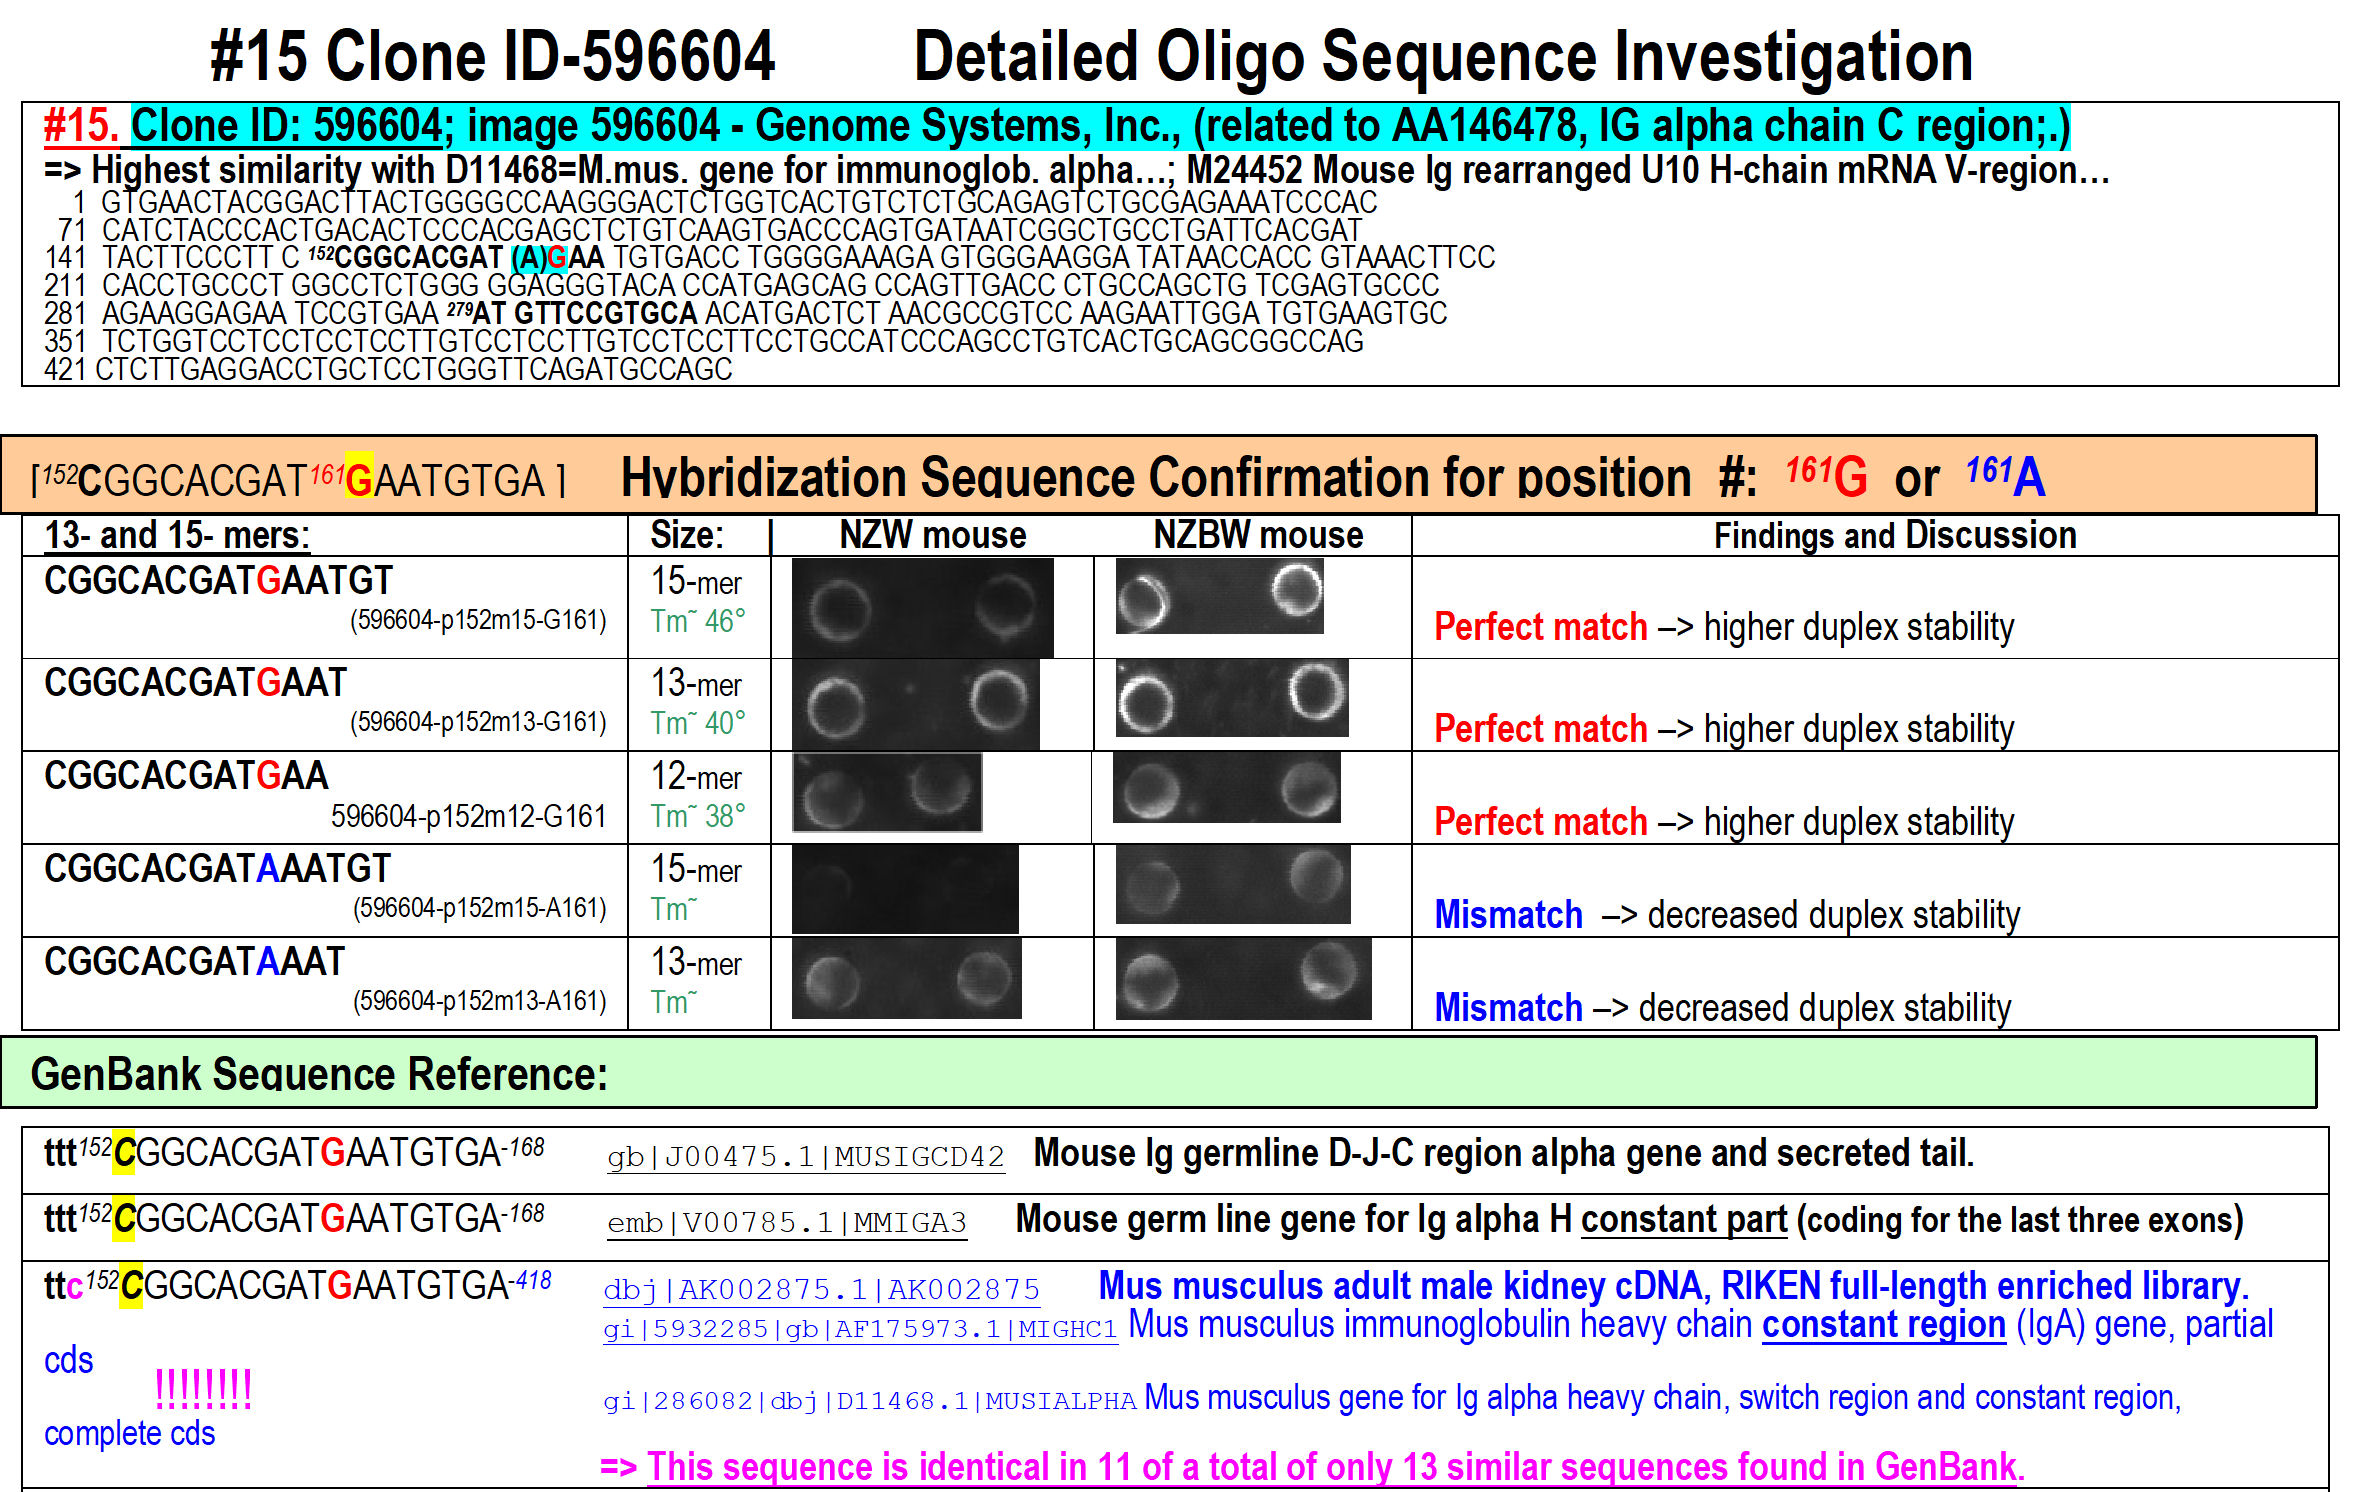
The results are represented on the figures
16, 17 and 18 below.
Figure 16.
Probing the hybridization conditions accuracy for single-base miss-match
discrimination depending upon the size of the oligonucleotide used – 12-,
13- and 15-mer tested on 2 arrays hybridized with cDNA-pools obtained from 2
mouse lines – one healthy and another exhibiting acute renal failure. Our
fingerprinting approach was so accurate, that it was able to detect
(unintentionally by expectation) a single-nucleotide inaccuracy within the
sequencing service initially performed for us by Genome System Inc – as
shown above in red (correct perfect-match
G)
and blue (incorrect single-miss-match
A)
coloring. At the bottom are shown the GenBank similarity hits confirming the
accuracy of the oligo-fingerprinting result shown above it)
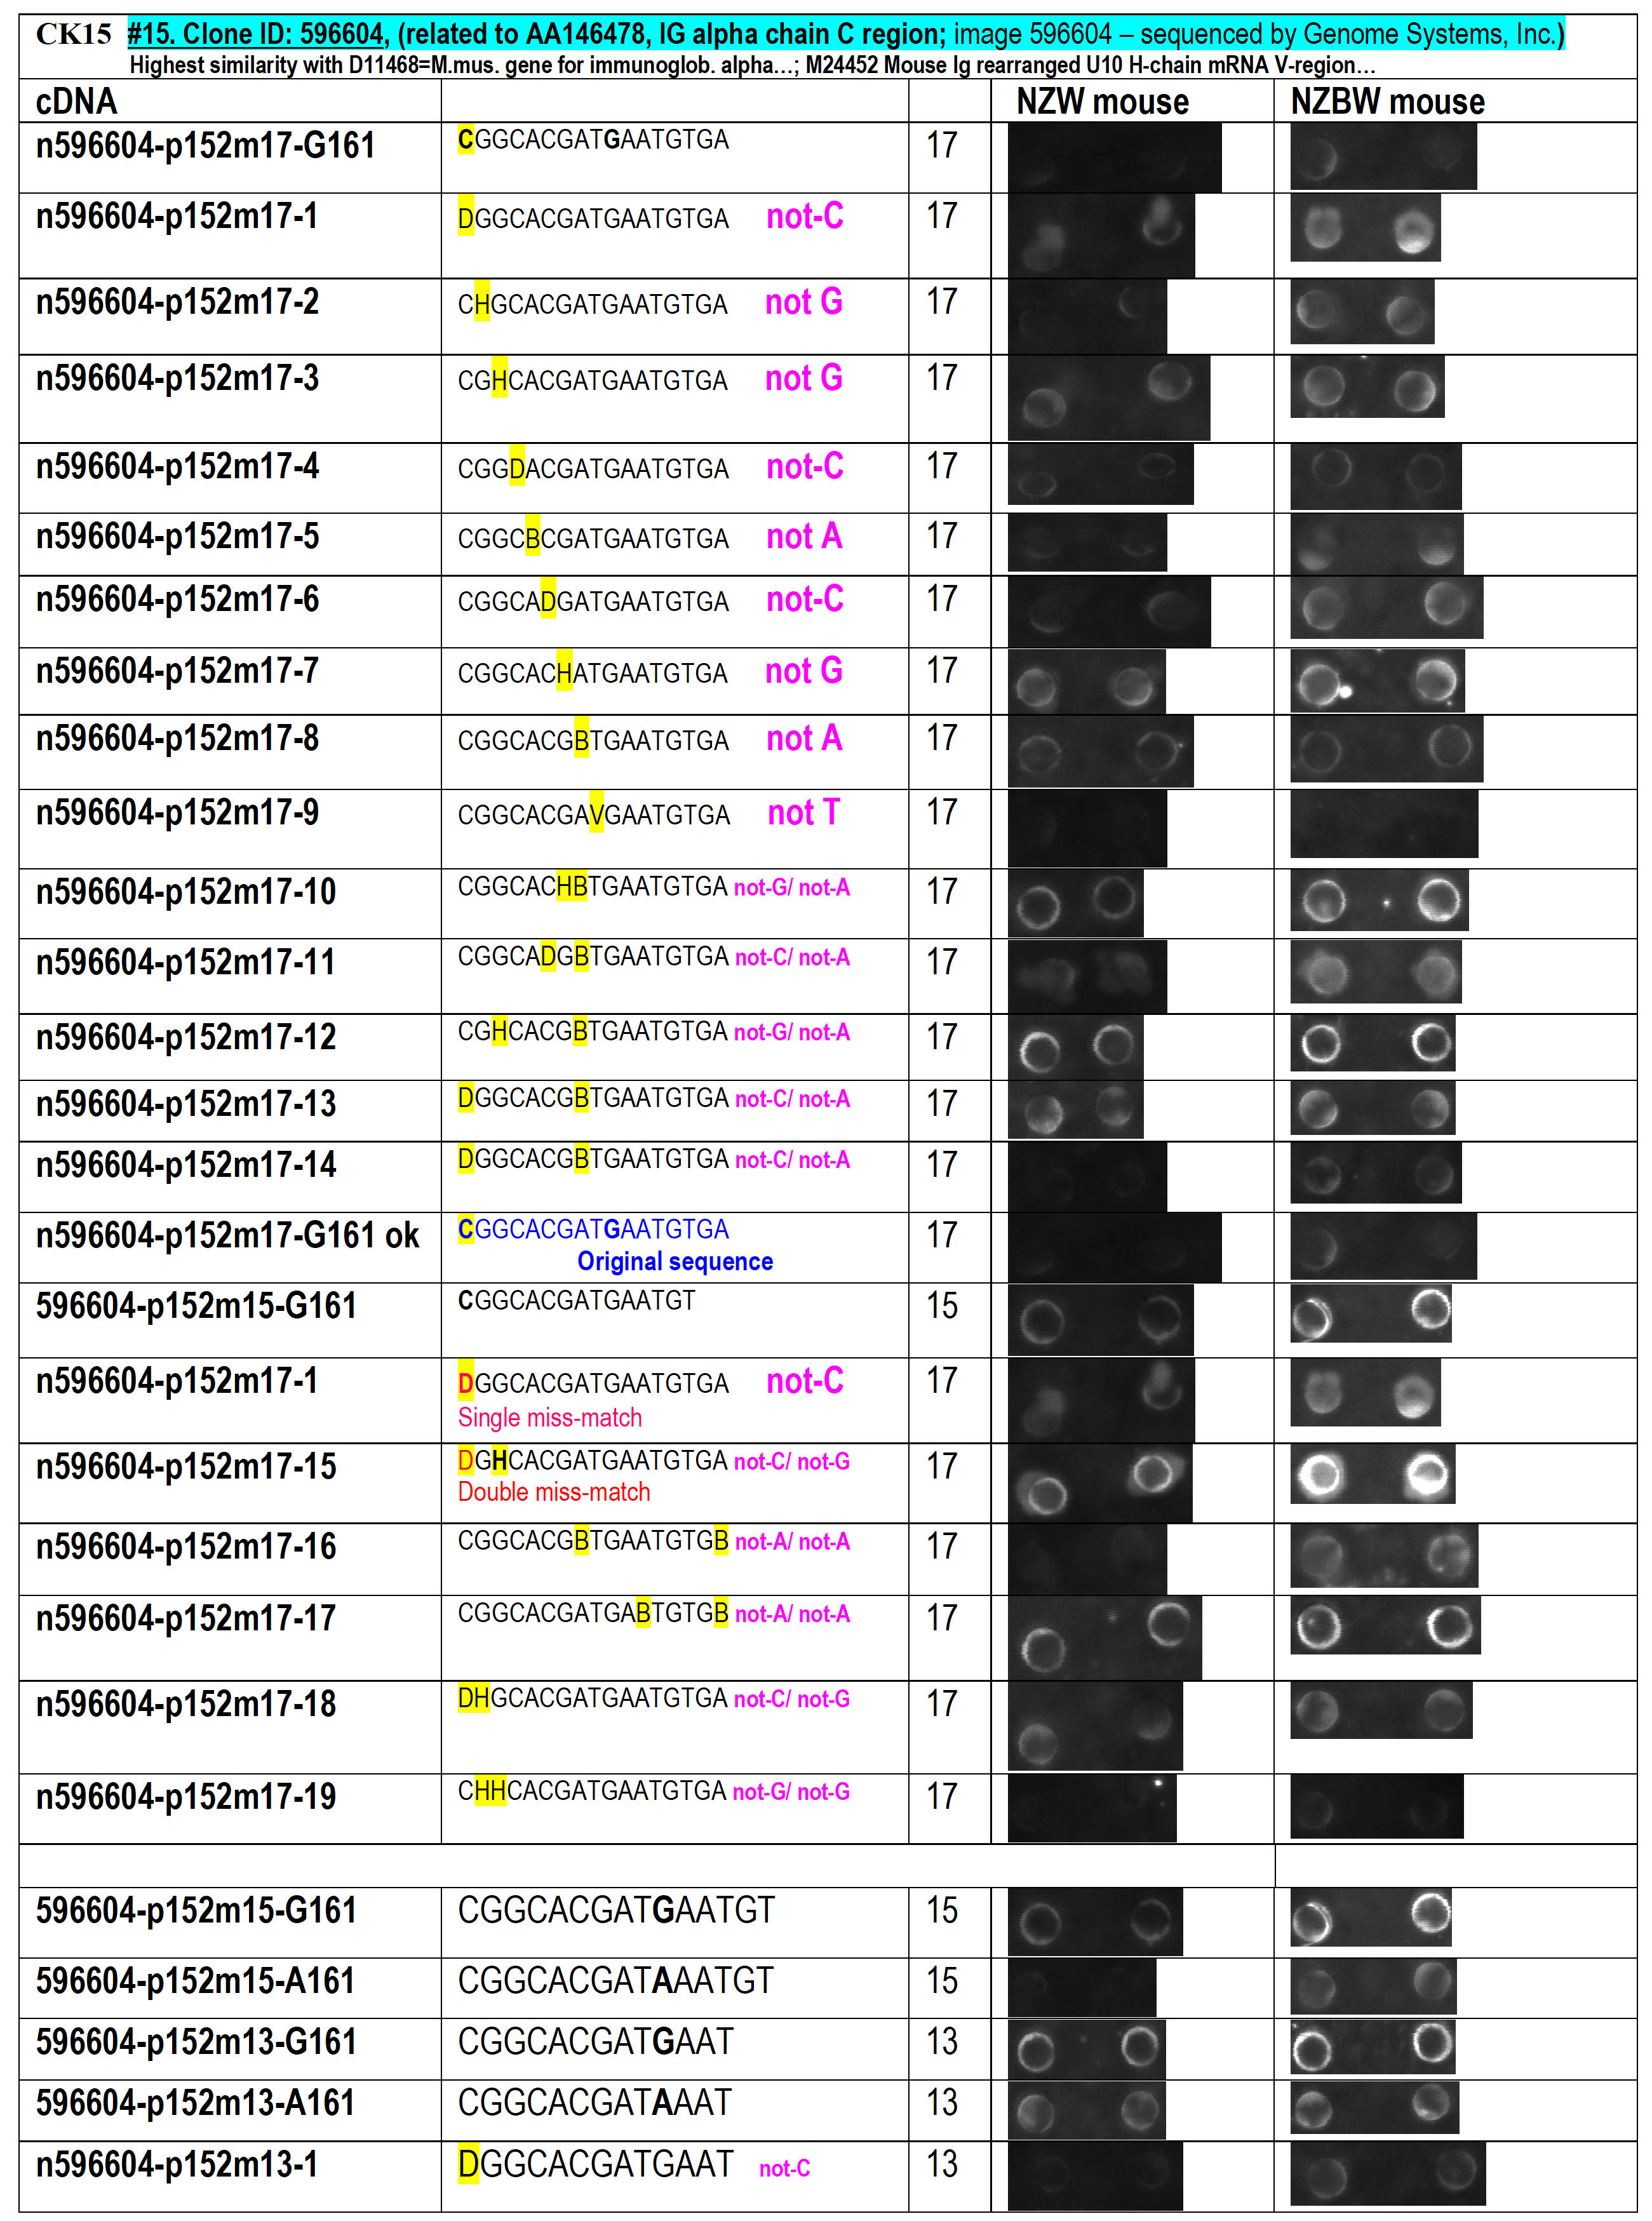
Figure 17. Probing the hybridization conditions accuracy for single-base miss-match discrimination depending upon the size of the oligonucleotide used – 13-, 15- and 17-mer tested on 2 arrays hybridized with total cDNA-probes obtained from 2 mouse lines – one healthy and another exhibiting acute renal failure. Also probing the applicability of single- and double- degenerated-nucleotide for the detection of a possible-existing single-base gene variations and/or unknown gene detection.
On Figure 17 is demonstrated
that the
n596604-p152m17-1
single-degenerated probe
does not detect noticeable signal difference among the two mice lines, but
the n596604-p152m17-15 double-degenerated oligo probe was capable to
detect the presence of unknown antibody gene-transcript within
the sick mice population that is absent within the healthy mice population
(note, that the signal in the Right-side image is significantly higher than
on the Left-side). This is in fact an unintentional discovery possibly
related to the pathogenic conditions among the particular mice population,
which is an almost amazing real practical confirmation of the
abilities of the oligo-fingerprinting approach pioneered by us.
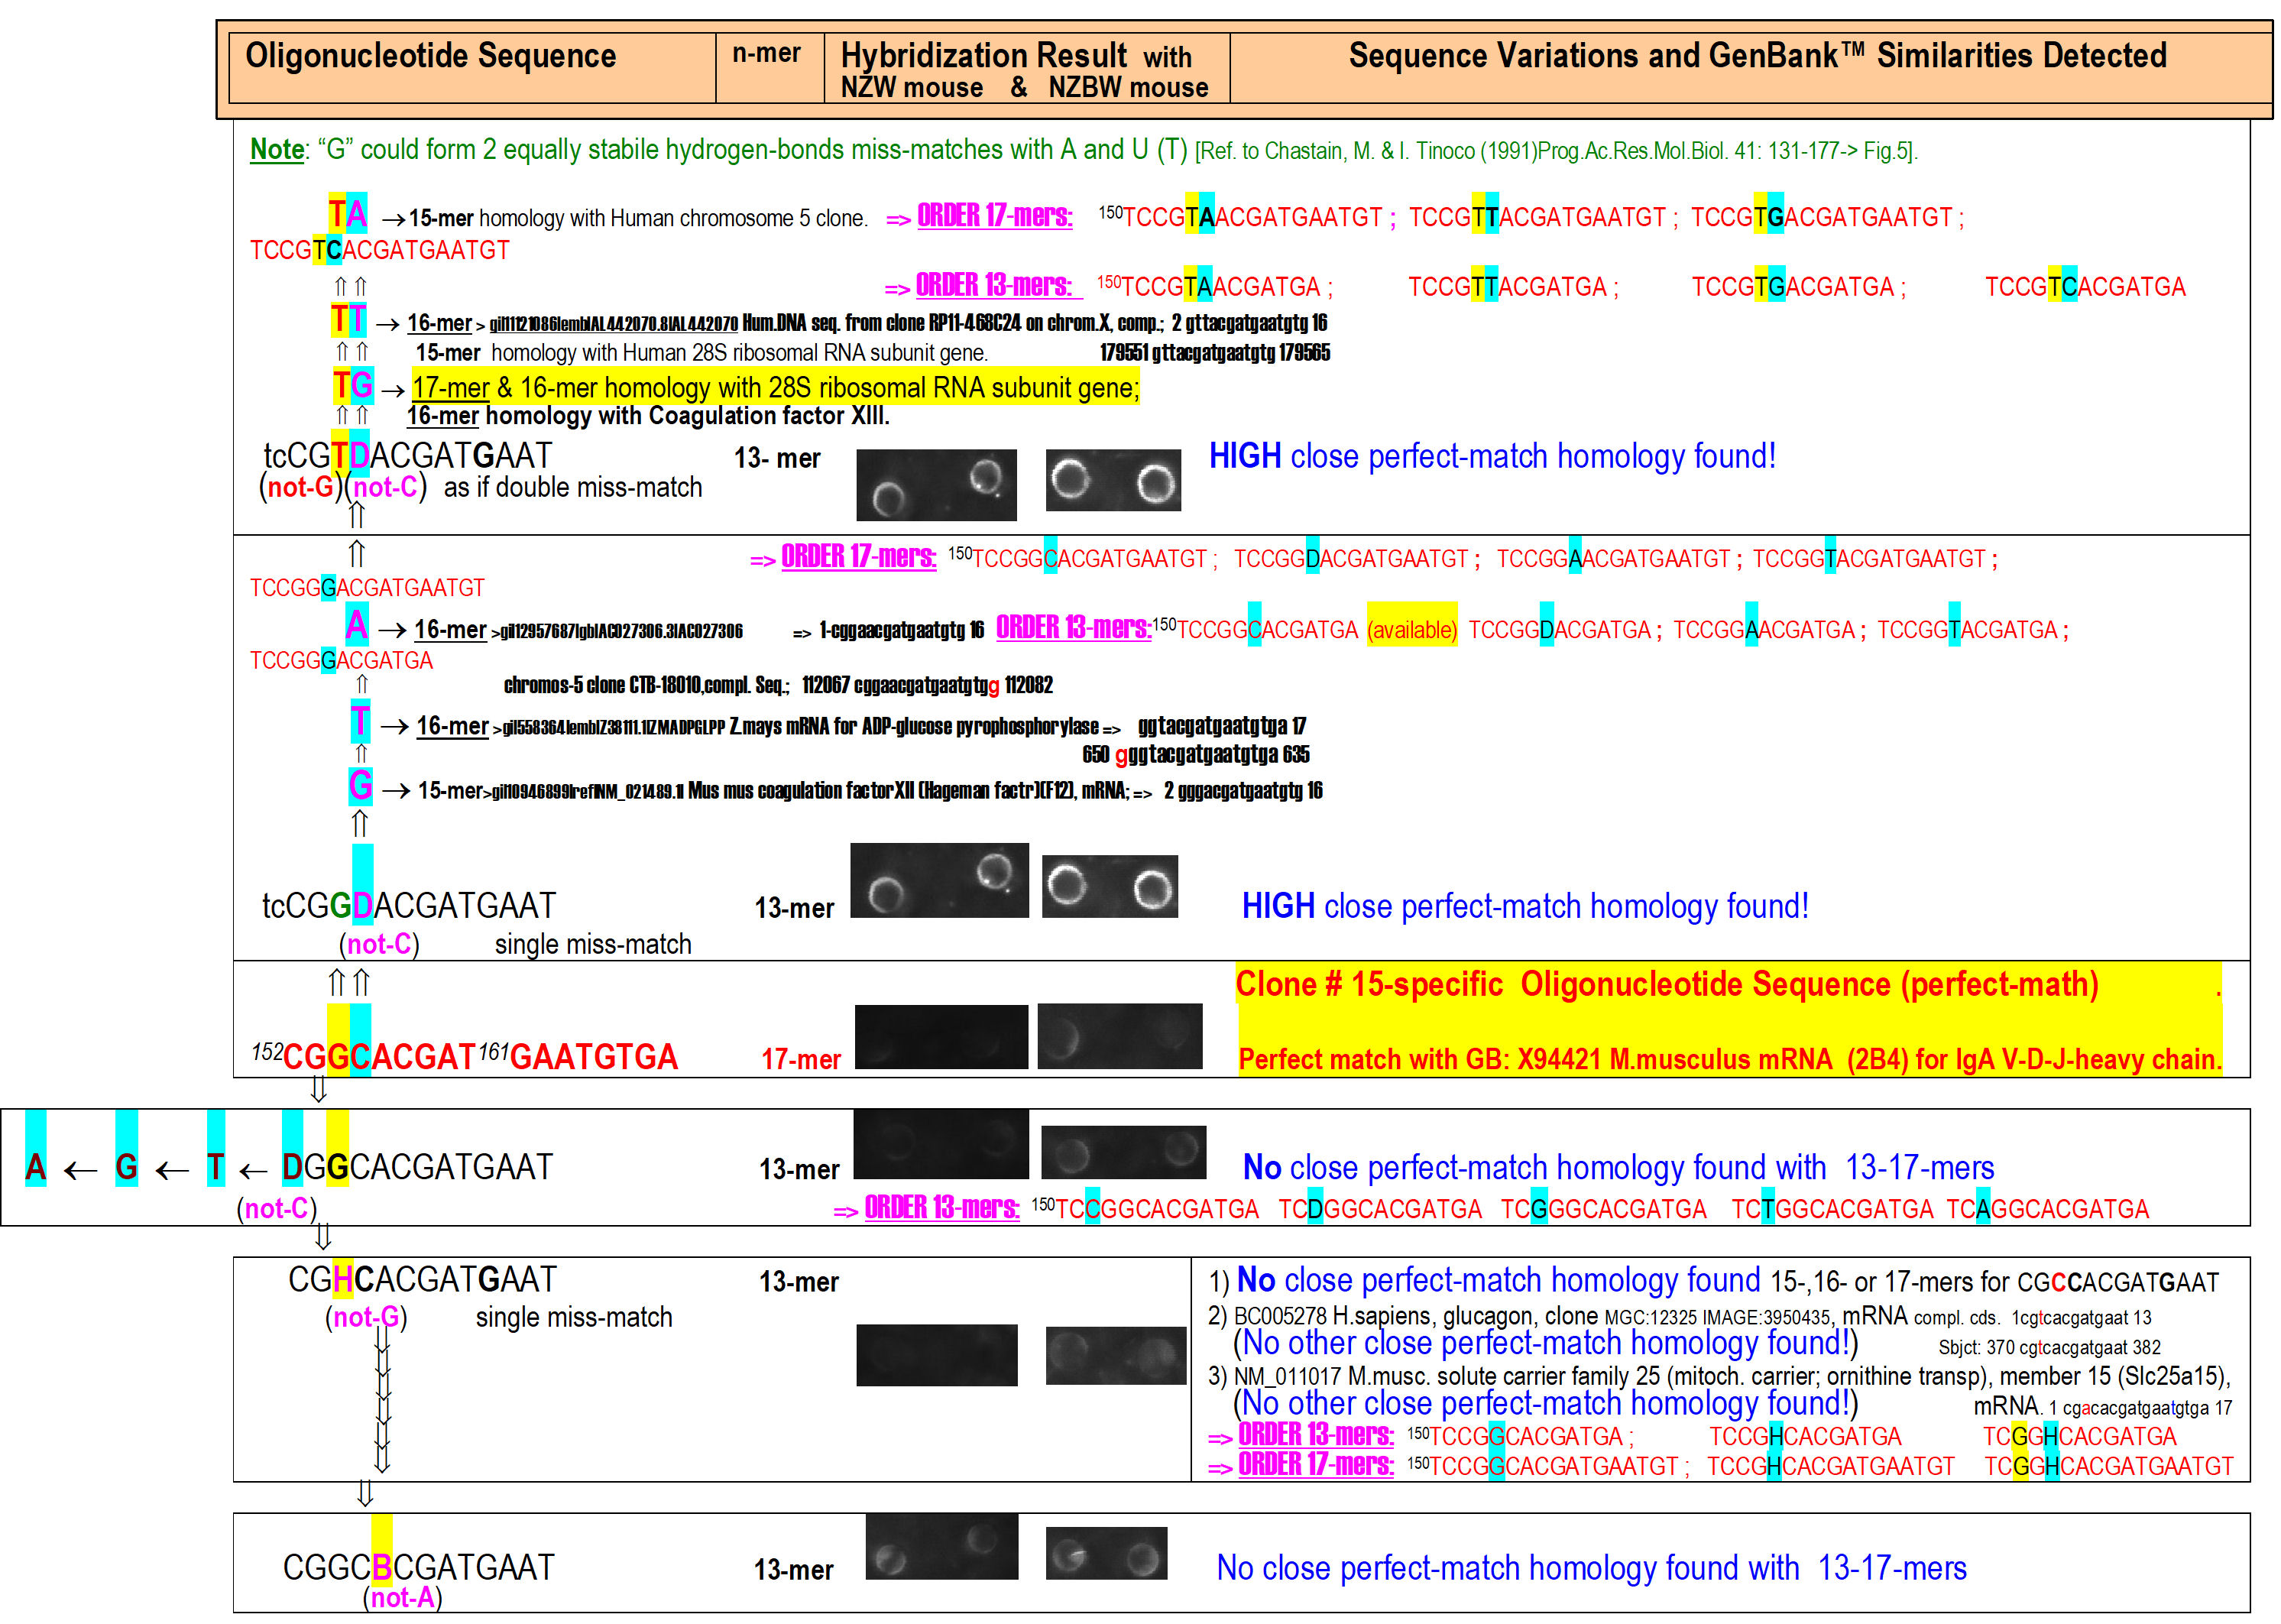
Figure 18. Figure 18. Probing the hybridization conditions accuracy for single-base miss-match discrimination depending upon the size of the oligonucleotide used – 13-, 15- and 17-mer tested on 2 arrays hybridized with total cDNA-probes obtained from 2 mouse lines – one healthy and another exhibiting acute renal failure. Also probing the applicability of single- and double- degenerated-nucleotide for the detection of a priori unknown genes present in the samples. This is a different gene fragment than the one used on Figure 17
On
Figure 18, in the middle (in Red, pasted in yellow) is shown that the
original commercially sequenced gene does not hybridize positively with
neither cDNA probe – suggesting for a mistake in the commercial sequence.
Just above it, however, the single-base
degenerated oligonucleotide exposes
the presence of another perfect-match gene fragment that is present in both
mice cDNA populations. Another perfect-match hit is detected (look above) by
another double-base degenerated oligonucleotide that was identified to be
highly abundant gene for the 28S ribosomal subunit.
The
results shown on figures 17 and 18 clearly demonstrate the ability of the
Oligonucleotide-Fingerprinting technology to identify even single-base
genetic variability and to identify previously unknown gene transcripts,
disease miss-alignments and the presence of pathogens. Further investigation
of the condition detecting the presence of an unknown antibody within the
sick mice and absent among the healthy ones (Figure 17) led to the discovery
for the first time of a genetic defect among the mice line engineered to
demonstrate renal failure. Thereby, the oligo-fingerprinting detection of
the presence of unique and unknown antibody among the sick mice led us to
the discovery of a pathogenic RNA-transcript, probably due to a fact that at
some point a mice virus integrated its gene in a fatal place within the
mouse genome that resulted in un-regulated and un-stoppable synthesis of
viral RNA and viral protein (in the absence of the virus) that was
triggering the mice immune system to attack it presuming there is alive
virus present in its body – in a long term this possibly was leading to
clogging the mice kidney with practically unnecessary
In
conclusion
We
have devised and refined a technology
involving strategy for entire gene‑libraries characterization by
DNA-sequence information recoding from the 4-letter nucleotide code to a
proprietary oligo‑nucleotide code
- for the creation of
oligonucleotide-hybridization based fingerprints of the probed gene
fragments. Thereby, the Oligonucleotide Fingerprinting served for
computational genetic clustering and identification of known and unknown
genes, and establishing sequence similarity relations between genes from
entire organism libraries with previously unknown genetic content. By our low-scale oligo-fingerprinting approach, we proved the concept that our technology of analyzing the GenBank® sequence data, proprietarily designing relatively limited number of short oligonucleotide sequences and experimental testing condition is capable of extremely precise detection of specific genes and gene transcripts (and their variations) present in any probe of any genetic background.
This technology demonstrates exceptional and unique ability to multiple
detection of pathogens (known or novel), of any-type genetic deficiencies
causing genetic diseases, detection of unknown antibodies expression as
causes of autoimmune diseases, and the presence of potential biohazard
agents in enclosed volumes of space (serving National biohazard-detection
purposes) – this is ALL-AT-ONCE DETECTION ON OLIGONUCLEOTIDE MICROARRAY
CHIPS.
This article is dedicated to support
our efforts to obtain funding support for the technology refinement and for
the preparation of compact oligonucleotide chips, and quick-processing
equipment in order to ensure the production and market-establishment of this
technology. This effort will serve for a revolutionary-wide spectrum of
medical diagnostics tests – similar (but already practically-achieved
long-ago in 1993-2003), to what the disgraced Theano’s company was promising
falsely.
Moreover, this technology becomes
extremely necessary to safeguard our National health- and bio-security for
ever-increasing novel pathogens, research miss-happenings, and rogue
bio-weaponizing – because it is universal, easily miniaturize-able and able
to deliver rapid bio-detection in any enclosed volume (transport or cargo)
within few hours.
We have also developed a research
project to miniaturize the detection capabilities for applications using
unmanned surveillance devices capable to deliver remotely pre-diagnostics
data to be computationally processed at analytic centers and facilities.
For more information and funding discussions,
please, contact Dr. Chris Dyanov at
regontechnologies@gmail.com,
regonmedical@gmail.com or at (773)
397-5496. |
 |
 |
 |
 |
 |
 |


